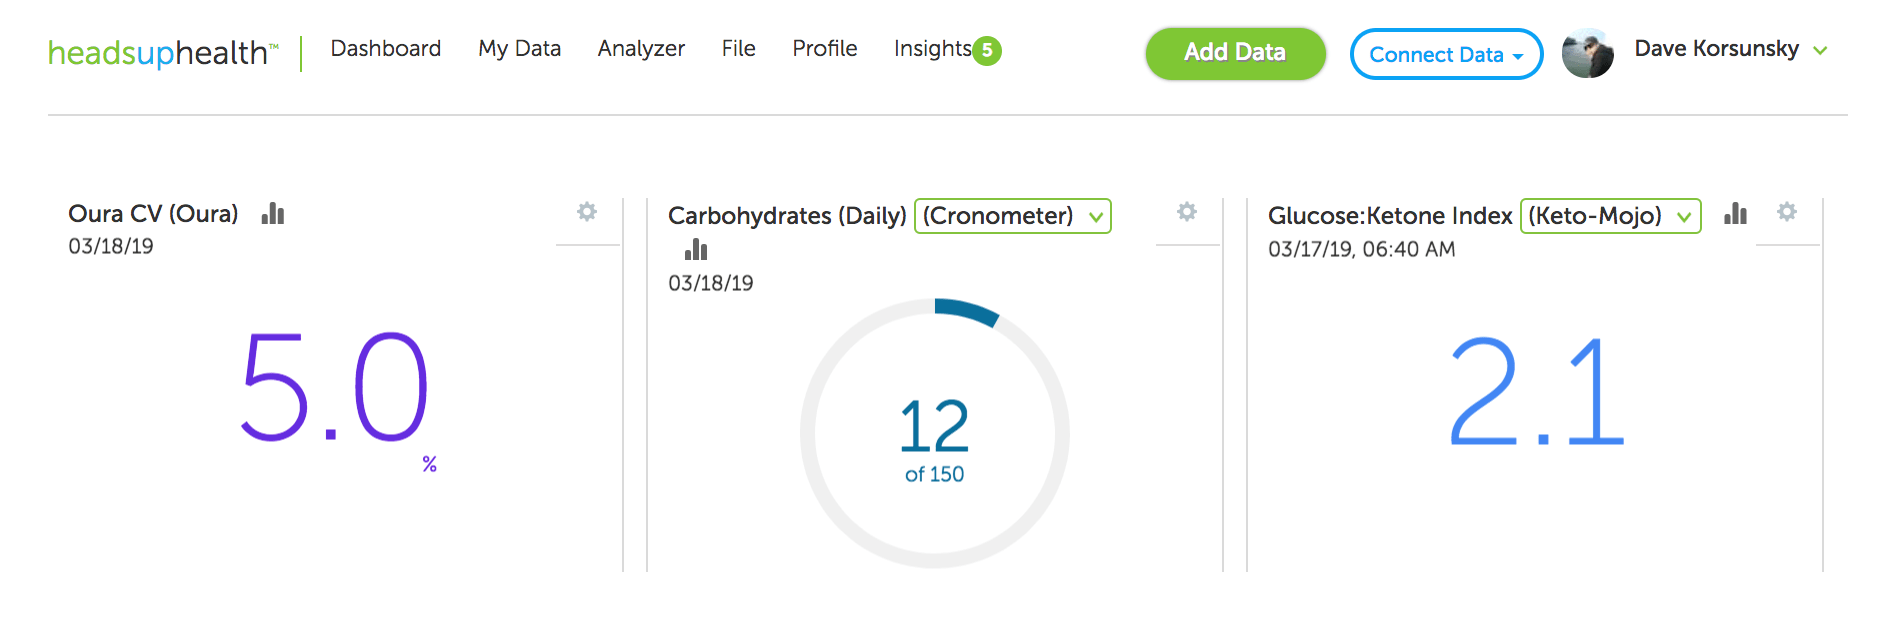
The real power in using Heads Up Health with Keto-Mojo is being able to track and correlate biomarkers you care about, such as the GKI (Glucose Ketone Index) with other major health metrics, like body measurements.
The leader in consumer software for personal health data analytics, Heads Up Health allows you to see your progress over weeks, month, years — all in one place. When used together with Keto-Mojo, the leader in affordable, accurate blood glucose and ketone testing meters, they’re a powerful force for helping you get into ketosis, maintain keto-adaptation, and see the big picture of your metabolic health and body composition.
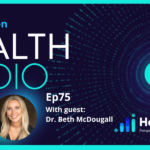
For example, our Social Media Manager, and avid Heads Up Health user, Lily Chien-Davis, correlated her GKI with her waist circumference measurements, whittling down her waist size while staying keto-adapted.
In the graph above, Lily shares how she used Keto-Mojo to track her glucose and ketones over the past 12 months, uploading those results to Heads Up Health where we automatically calculate the glucose-ketone index (GKI), a powerful biomarker for tracking your metabolic health.
The graph speaks for itself as Lily slashed over five inches off her waist circumference!
Lily first discovered the glucose ketones index as a biomarker when her husband was diagnosed with cancer in 2014. They used a therapeutic ketogenic diet as an adjunct to conventional treatment, consulting with Miriam Kalamian [1] and following the advice of cancer researcher, author [2] and inventor of the GKI, Thomas N Seyfried and his advice to keep the glucose ketone index low, “tracking the ratio of blood glucose to ketones as a single value”, in an effort to blast the tumors near her husband’s aorta. [3]
As they both carefully monitored his glucose ketone index and watched his tumors rapidly shrink, she began eating keto too, surprised, as someone diagnosed with pre-diabetes, to watch her own HbA1c go down, from 5.9% to 5.2%. In 2016, she discovered Heads Up Health while listening to keto podcasts (i.e., Jimmy Moore, Ketovangelist, 2 Keto Dudes). Both she and her husband immediately signed up, excited to track their glucose, ketones, and GKI alongside their medical records and body composition data, such as weight and waist size.
Since then, Lily has never looked back.
Instead of using a scale to track her weight every day, which can be maddening because weight loss is never linear, she tracks her GKI alongside her waist circumference and weight once a month using our measurements feature. In the beginning she also tracked her macros, but now relies solely on eating an intuitive keto-paleo and sometimes carnivore diet, preferring to track her GKI regularly, using the graphing feature in Heads Up Health’s Analyzer to reflect on her progress, helping her stay motivated.
Here’s Lily’s before/after photos and you can see how great she looks. Most importantly, she FEELS awesome, both mentally and physically.
“Tracking with Keto-Mojo and Heads Up Health helped me to stay in ketosis and keto-adapted for over a year, giving me accountability and motivation to keep keto-ing on. Although I’m not completely where I’d like to be just yet, I’m free of all prescription meds, happier and healthier than I’ve ever been. My husband is now almost 4 years in remission and we recently sold our house to move into, travel and worldschool our kid in a RV, a dream we hatched up during long days of chemo infusions. People say keto is restrictive, that it’s a fad diet, but because I’ve used it for mental and physical health, it’s just a way of life for me now. The rest — feeling younger, more energy to actually want to exercise, mental clarity, and better body composition — is just icing on the cake!” – Lily Chien-Davis
It takes a lot of courage to share this information so please give Lily a shout-out on Instagram (@hellbentonbliss). We love you Lily!
Written by Andrew Flatt, Dave Korsunsky and Chuck Hazzard
Overview
We’ve released an experimental feature in Heads Up Health which automatically calculates the HRV coefficient of variation (CV) based on the data from your Oura ring.
Why track HRV CV?
Looking at daily HRV readings enables you to note short-term fluctuations relative to your baseline. This can be useful for observing the effects of various stressors and lifestyle factors which can help inform on behavior-modification strategies to optimize your HRV.
Due to daily fluctuations, an isolated (i.e., single time-point) HRV measure may not truly reflect an individual’s typical HRV. Thus, some researchers and practitioners are moving towards averaging a series of daily measures to better characterize one’s autonomic activity. In turn, most HRV apps are now reporting a rolling weekly average of your HRV values.
Tracking the rolling weekly average provides a better indication of whether your HRV is actually changing in a given direction. In addition, instead of reacting to an isolated change in HRV, a more conservative and convenient approach would be to react only when the rolling average starts to change. One low HRV reading may not be of much concern and would have little impact on the weekly average. However, a series of low scores will reduce the rolling average and may indicate that it’s time to do something about it.
Along with your rolling weekly HRV average, further insight can be gained by monitoring the Coefficient of Variation (CV) among the rolling HRV values. This is because the magnitude of HRV fluctuations can change from week to week, with or without out much change in the rolling average. How much your HRV fluctuates on a day-to-day basis is quite meaningful. Large fluctuations increase the CV while smaller fluctuations lower it.
Interpreting HRV Coefficient of Variation (HRV CV) values
Typical HRV CV values range from 2 – 20%. If we were to take a random sample of adults and measure their HRV for a week, we would probably find that individuals who are younger, healthier (i.e., without disease), leaner and more aerobically fit will fall on the lower end of that range and less-healthy individuals on the higher end.
Regardless of what your CV is at a given time, it’s important to know that it can and will change. Now, whether an increase or decrease in your CV should be interpreted as good or bad is entirely context-dependent. We’ll use some practical examples to explain.
Among healthy individuals, an increased CV is typically associated with greater stress, fatigue, and lower fitness. Vice versa for a lower CV. Thus, the CV is a useful value for assessing adaptation to a new fitness program or lifestyle change. For example, unfamiliar stress will typically cause greater fluctuations in HRV (i.e., increased CV). However, as you become familiar with the new routine, there should be less fluctuation (i.e., decreased CV) which is a sign of positive adaptation. What was once quite stressful to your body is no longer as stressful.
Reductions in the CV are typically good, indicative of increasing fitness, lower stress (or improved stress tolerance) and so forth. There are exceptions, however. For example, suppose your new training program or work schedule is overbearing. Accumulating stress causes an initial increase in your CV. As things continue, your healthy eating habits start to wane, your sleep deteriorates and you become rundown. In this context, your HRV readings may become chronically suppressed, failing to bounce back to baseline. Thus, your rolling average has now decreased, as has your CV.
How we calculate Oura HRV CV
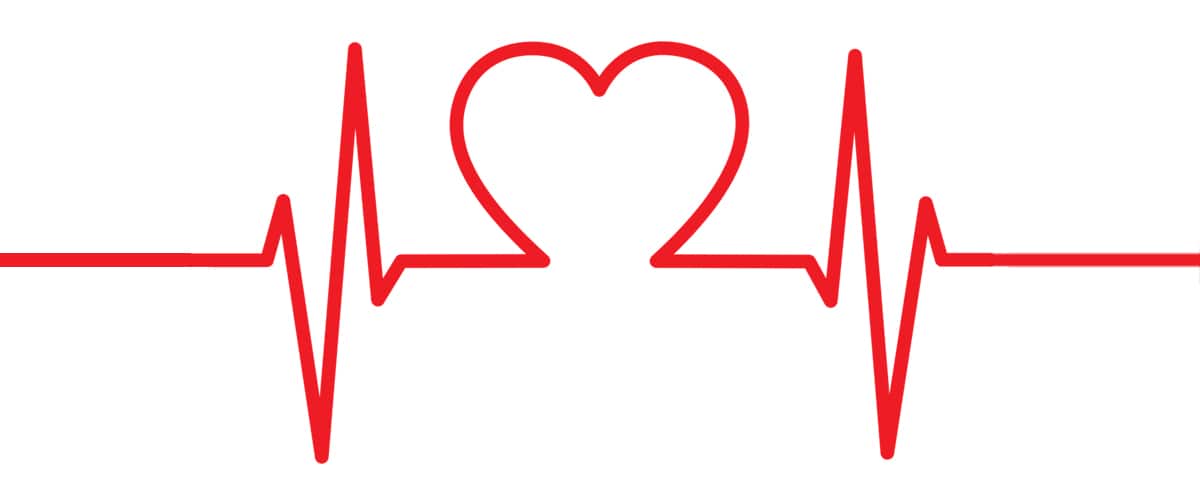
At the time of this post, Oura currently does not report the HRV CV in their app. Thus we are calculating this in Heads Up Health using the average HRV value during the sleep cycle as reported by the Oura app:
Figure 1: Oura HRV Average
Using these average HRV values we then calculate the Oura Coefficient of Variation (HRV CV) as follows:
Calculate the natural logarithm (ln) value of the nightly HRV average as reported by the Oura app (figure 1)
Calculate the mean and standard deviation from the prior 7-day HRV values
Divide the standard deviation by the mean
Show as a percentage
Note: Some experts in the field have suggested a more accurate method would be to look at the Oura HRV readings from the deep (slow wave) sleep states or by looking at the HRV readings just prior to waking. We are open to changing our approach here based on feedback from users. Feel free to send us your comments.
Tracking Oura CV in Heads Up Health
You can now add the Oura CV metric onto your Heads Up Health dashboard:
Figure 2: Add the Oura HRV CV to your dashboard
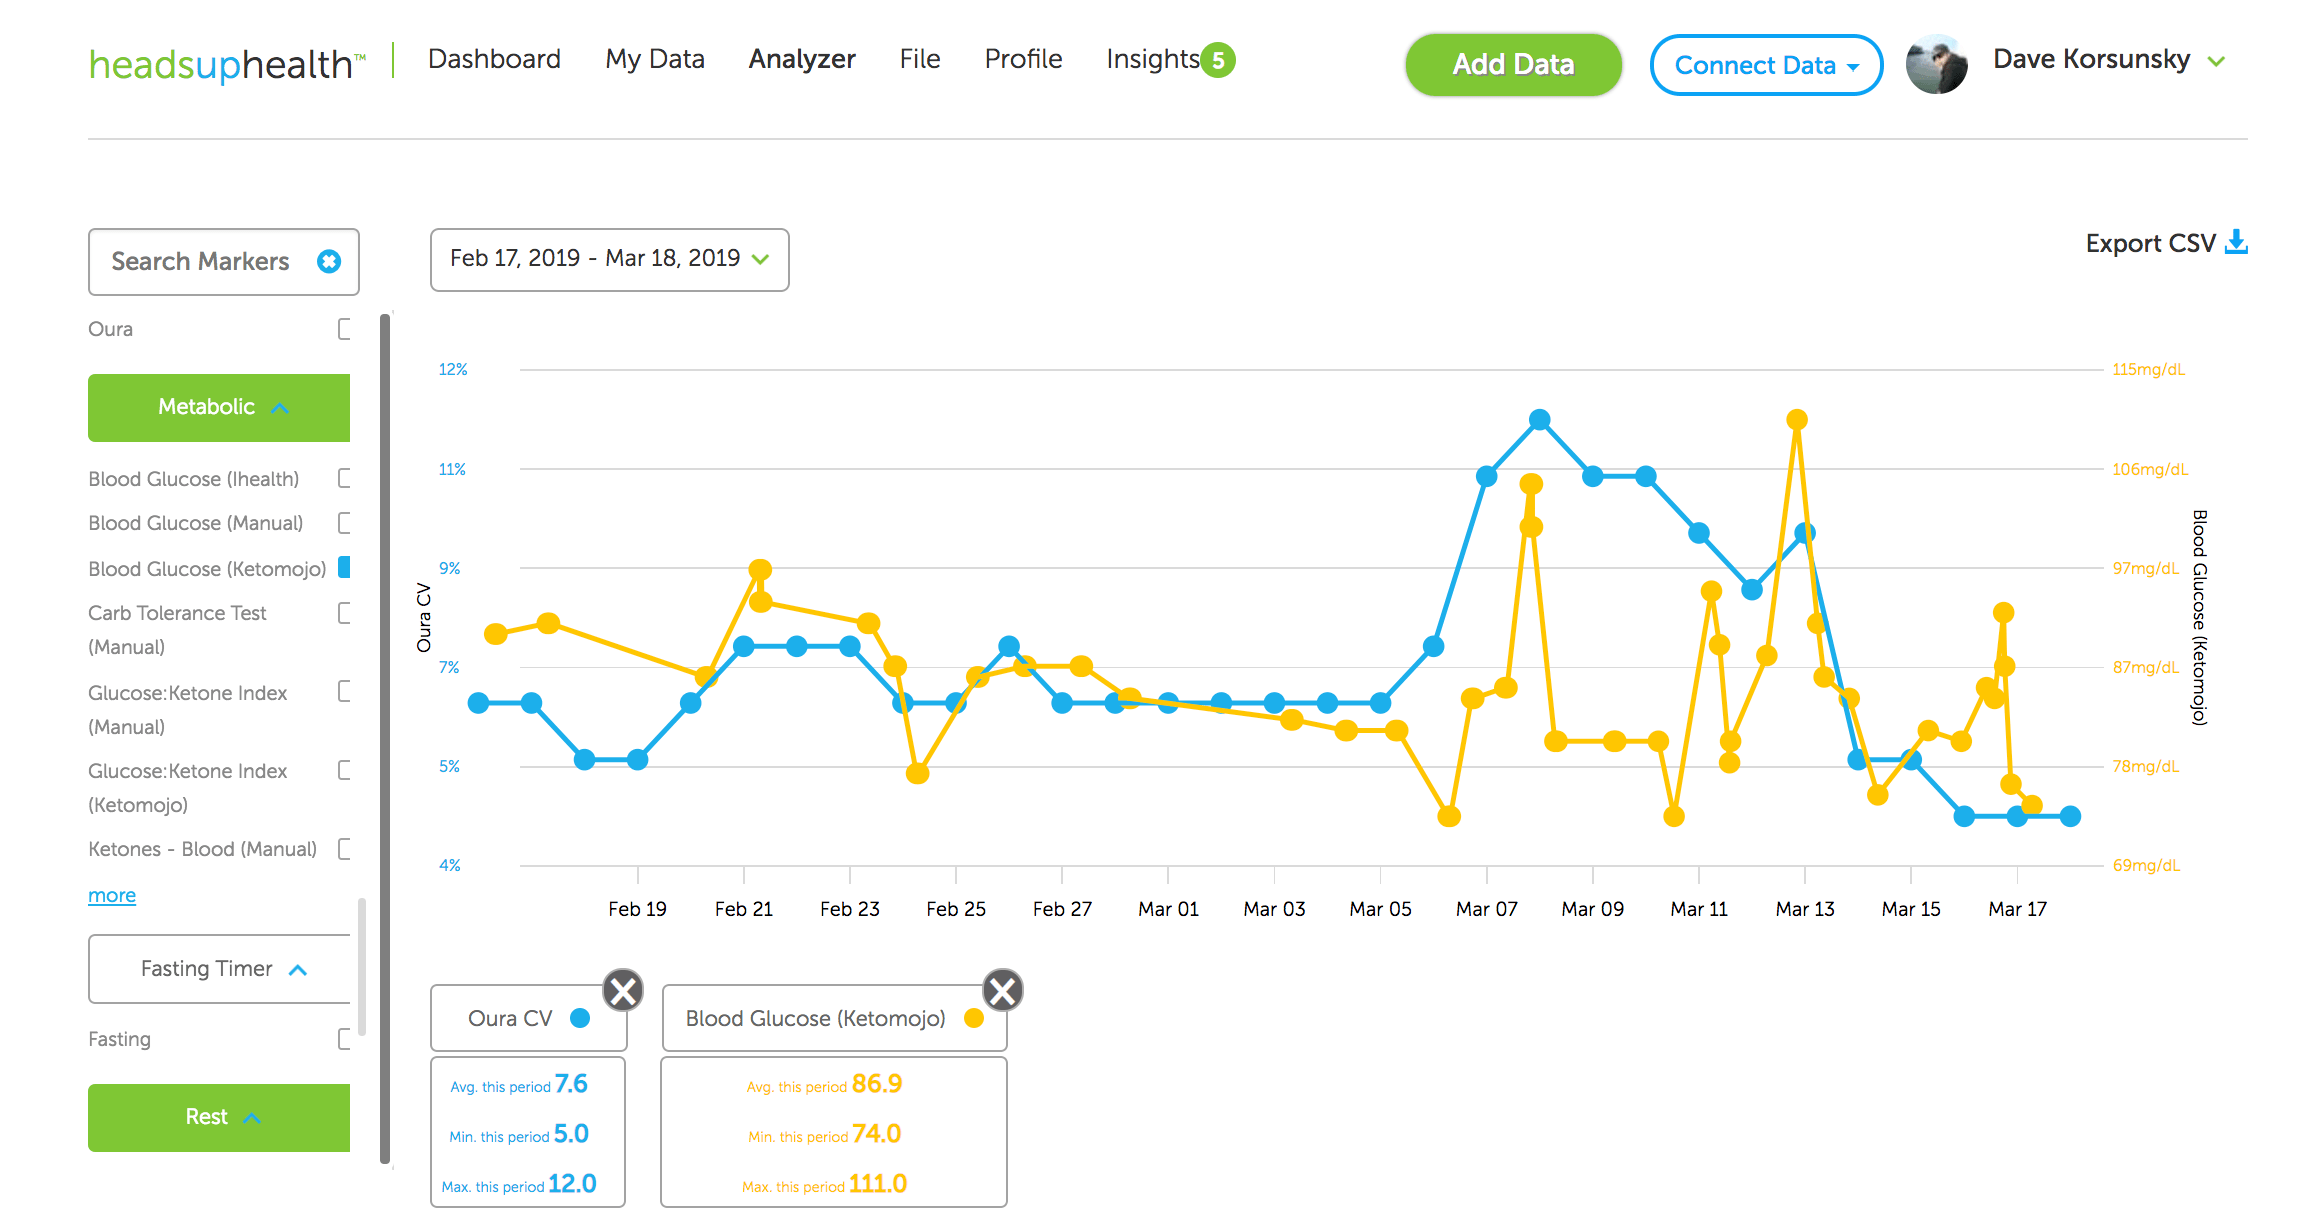
You can also graph this marker on the Analyzer next to any other health metric to explore your own correlations:
Figure 3: Compare your Oura HRV CV metrics on the Analyzer
Moving the needle
Why would these numbers increase or decrease? The CV reflects the fluctuation in your day-to-day HRV over the last 7 days. High or low HRV readings relative to your baseline will, therefore, contribute to a higher CV whereas more consistent or stable HRV readings will contribute to a lower CV.
Why is lower better?
When the rolling average is stable or increasing, a lower CV reflects less disturbance in autonomic homeostasis. This may mean that you are experiencing less stress or simply coping with it better.
The CV must always be interpreted in context. For example, a night of high-quality sleep may increase HRV well-above baseline, contributing to a higher CV. In a situation like this, the elevated CV is obviously not reflecting higher stress. In addition, stress is important as it stimulates adaptation. Therefore, an increased CV is a normal response to a greater or novel stimulus. However, repeated exposure and adaptation to the stimulus should provoke smaller HRV fluctuations over time and therefore a lower CV. Here, the reduced CV reflects an improved ability to tolerate and recover from the stressor and thus a capacity for greater stress.
Important lifestyle factors which can affect HRV CV
Any factor that alters HRV from baseline contributes to an increased CV. Common factors that affect HRV include:
Travel/jet lag
Physical stress such as high-intensity exercise
Mental and emotional stress
Over-training / injury
Sleep quality and quantity
Illness
Drastic changes to daily routines
Pain
Blood sugar fluctuations
Hydration
Heads Up Health can help you holistically track these other lifestyle factors to help identify areas that need attention.
Summary
The HRV CV is another powerful biomarker we can use to further understand how we are managing the stressors in our daily lives. Heads Up Health now supports this metric. This is an initial implementation and we will further refine this feature as required.
Ready to start tracking your Oura HRV CV? Start your free trial using the button below!
[maxbutton id=”9″ ]
References and Recommended Reading on the CV
Flatt, A.A. Improving HRV Data Interpretation with the Coefficient of Variation https://elitehrv.com/improving-hrv-data-interpretation-coefficient-variation
Buchheit, M., Mendez-Villanueva, A., Quod, M. J., Poulos, N., & Bourdon, P. (2010). Determinants of the variability of heart rate measures during a competitive period in young soccer players. European journal of applied physiology, 109(5), 869-878.
Flatt, A. A., & Howells, D. (2019). Effects of varying training load on heart rate variability and running performance among an olympic rugby sevens team. Journal of science and medicine in sport, 22(2), 222-226.
Flatt, A. A., Esco, M. R., Allen, J. R., Robinson, J. B., Earley, R. L., Fedewa, M. V., … & Wingo, J. E. (2018). Heart rate variability and training load among national collegiate athletic association division 1 college football players throughout spring camp. The Journal of Strength & Conditioning Research, 32(11), 3127-3134.
Flatt, A. A., & Esco, M. R. (2016). Evaluating individual training adaptation with smartphone-derived heart rate variability in a collegiate female soccer team. The Journal of Strength & Conditioning Research, 30(2), 378-385.
Flatt, A. A., Hornikel, B., & Esco, M. R. (2017). Heart rate variability and psychometric responses to overload and tapering in collegiate sprint-swimmers. Journal of science and medicine in sport, 20(6), 606-610.
Flatt, A. A., Esco, M. R., Nakamura, F. Y., & Plews, D. J. (2017). Interpreting daily heart rate variability changes in collegiate female soccer players. J. Sports Med. Phys. Fitness, 57, 907-915.
Flatt, A. A., & Esco, M. R. (2015). Smartphone-derived heart-rate variability and training load in a women’s soccer team. International journal of sports physiology and performance, 10(8), 994-1000.
Nakamura, F. Y., Pereira, L. A., Rabelo, F. N., Flatt, A. A., Esco, M. R., Bertollo, M., & Loturco, I. (2016). Monitoring weekly heart rate variability in futsal players during the preseason: the importance of maintaining high vagal activity. Journal of sports sciences, 34(24), 2262-2268.
Plews, D. J., Laursen, P. B., Kilding, A. E., & Buchheit, M. (2012). Heart rate variability in elite triathletes, is variation in variability the key to effective training? A case comparison. European journal of applied physiology, 112(11), 3729-3741.
Tonello, L., Reichert, F. F., Oliveira-Silva, I., Del Rosso, S., Leicht, A. S., & Boullosa, D. A. (2016). Correlates of heart rate measures with incidental physical activity and cardiorespiratory fitness in overweight female workers. Frontiers in physiology, 6, 405.
In this post we will take a look at how Heads Up Health can help you successfully navigate the challenges of implementing and maintaining a ketogenic diet. In particular, we will introduce tools that can help you track your progress, fine tune your approach and find exactly what works for your own body as you adopt a low-carb ketogenic lifestyle.
(more…)
While a ketogenic diet may have gained a lot of popularity recently, it’s origin dates back to 1923, when Dr. Russell Wilder started using it at the Mayo Clinic for the treatment of pediatric epilepsy. At the time, pharmaceuticals were not available to treat epilepsy, and it quickly became the go-to treatment due to its efficacy.
Though we now have drugs to support the suppression of seizures in those with epilepsy, not all medications work for everyone, and some individuals have found they have even better control when they eat a ketogenic diet. And not to be exclusive, one therapy can exist with the other, meaning you can combine a ketogenic diet with the therapies you’re already on and may even find that over time you’ll be able to reduce those medications, though you should always communicate with your provider of significant dietary changes so they can monitor your medications. *never go off medication without your doctor’s support and guidance. Sudden withdrawal of anti-seizure medications can cause seizures.
What is the ketogenic ratio?
Simply put, the ketogenic ratio is the ratio of fats to carbs + protein in grams measurements in the diet. While most ketogenic diet followers won’t go quite this far with their tracking, it can be critically important for those following a ketogenic diet for therapeutic reasons, like epilepsy.
As you can imagine, calculating this out for every meal can be very time consuming if done manually, which is why automating these calculations whenever possible can decrease the frustration that parents or individuals sometimes feel when using a ketogenic diet for therapeutic reasons.
What is The Classic Ketogenic Diet?
A classic ketogenic diet requires a high level of fat with a very low level of combined carbs and proteins, usually 4:1 or 3:1 (fats to carbs+protein)
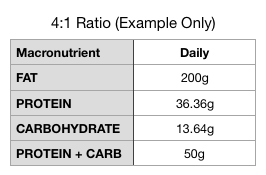
For example, on a 2000 calorie diet with a 4:1 ratio, you would have 200g of fat, and a combined total of 50g carbs + protein.
As you can see below, the carbs and the protein are further broken down based on the individual’s protein need to roughly 6% protein and 4% carbohydrates. Your doctor or nutritionist may modify this depending on your body weight, activity level, and seizure control.
Note* This is an example only. Your calculations will be custom to you and your dietary needs.
Which ratio is better?
That really depends on your goals. While a 4:1 ratio may be how the diet originated, most adults use more of a 3:1 ratio due to their increased need for protein based on weight, but this all depends on your level of seizure control and should be determined by your doctor. You can read more about the different ratios on the Charlie Foundation’s website here.
Isn’t a ketogenic diet hard?
When the ketogenic diet comes up in regards to a child’s therapeutic diet, it is often met with resistance because it seems difficult or hard to comply with. However with the recent interest in the ketogenic diet for many applications-from diabetes, to cancer, to weight training, it has become much more common, with food bloggers making it a common household word. Add in all of the apps available for calculating macronutrients, and pair it with your Heads Up Health profile removing all the calculating and it becomes much easier!
How can I do a ketogenic diet without calculating everything?!
Though macronutrient ratios need to be more specific and consistent with a therapeutic ketogenic diet, it no longer has to be complicated to track. Heads Up Health has integrated another new feature to let you track your ketogenic ratio when linked to your food tracking app like Cronometer,My Fitness Pal, MyMacros+ or FitBit nutrition trackers.
Just enter all of your foods eaten into your food tracker, which will link with your Heads Up Health account, and the calculations for your ketogenic ratio are done for you, letting you know at a glance if you’re on track or not. With the new mobile app (coming soon), you’ll have this info easily at your fingertips at all times.
How to set up your Heads Up Health profile for ketogenic ratio tracking
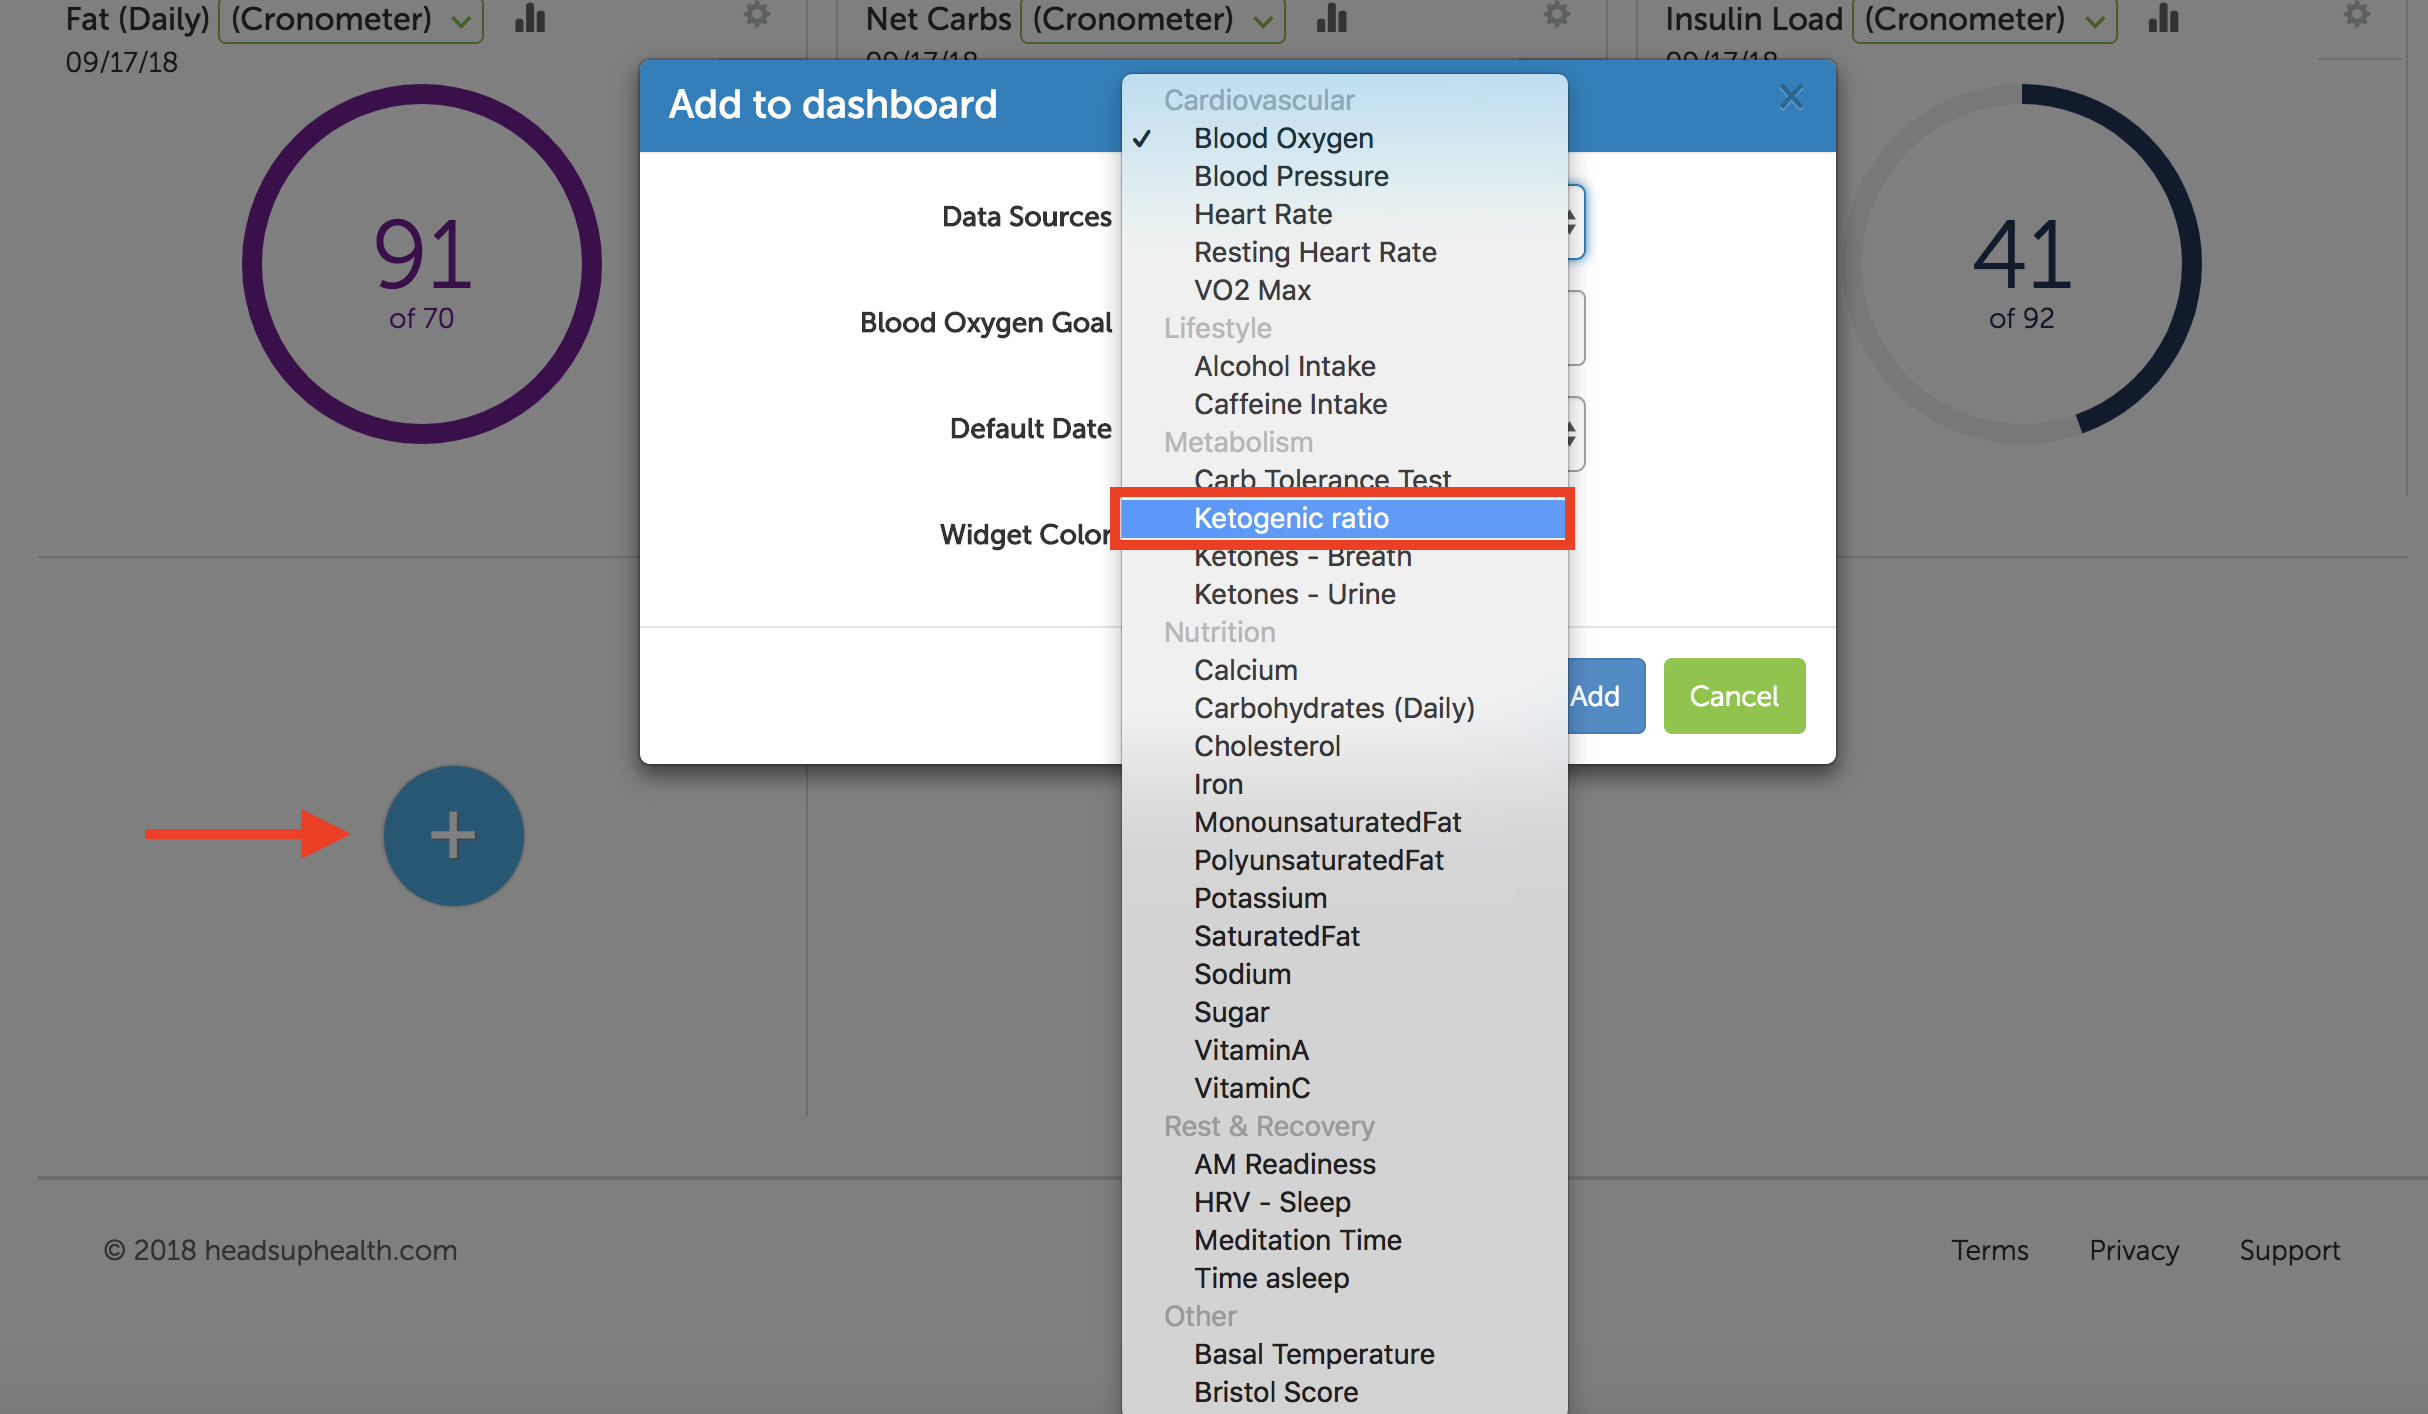
To get your ketogenic ratio widget, click on the “+” button at the bottom of your widgets, click on “data source,” and select keto ratio from the drop-down menu. From there you will enter your goal. If you are aiming for a 3:1 ratio, enter 3 in this field.
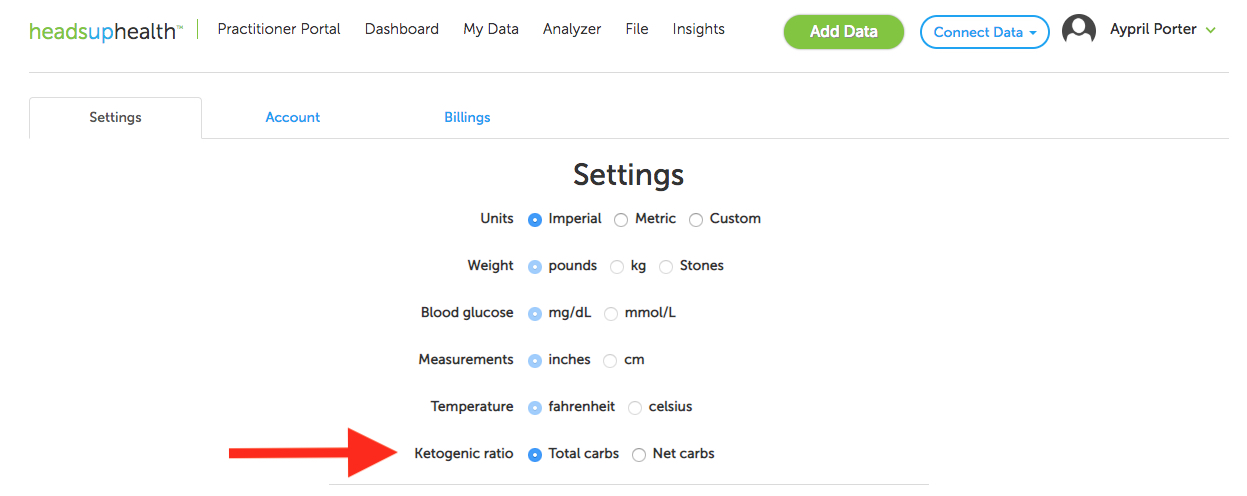
Once you have your widget, you can drag it to the top of the screen, so it’s easily viewed. Next, click on your username in the top righthand corner of the page, click on Settings and select either total or net carbs under the ketogenic ratio section.
Total Carbs include the total amount of carbohydrates in your food.
Net Carbs is total carbs minus fiber in that food.
If you select total carbs, you’ll be complying more strictly; however, you will be allowed much fewer carbs than if you choose net carbs and account for the fiber that slows the carbohydrate’s glucose response in your body.
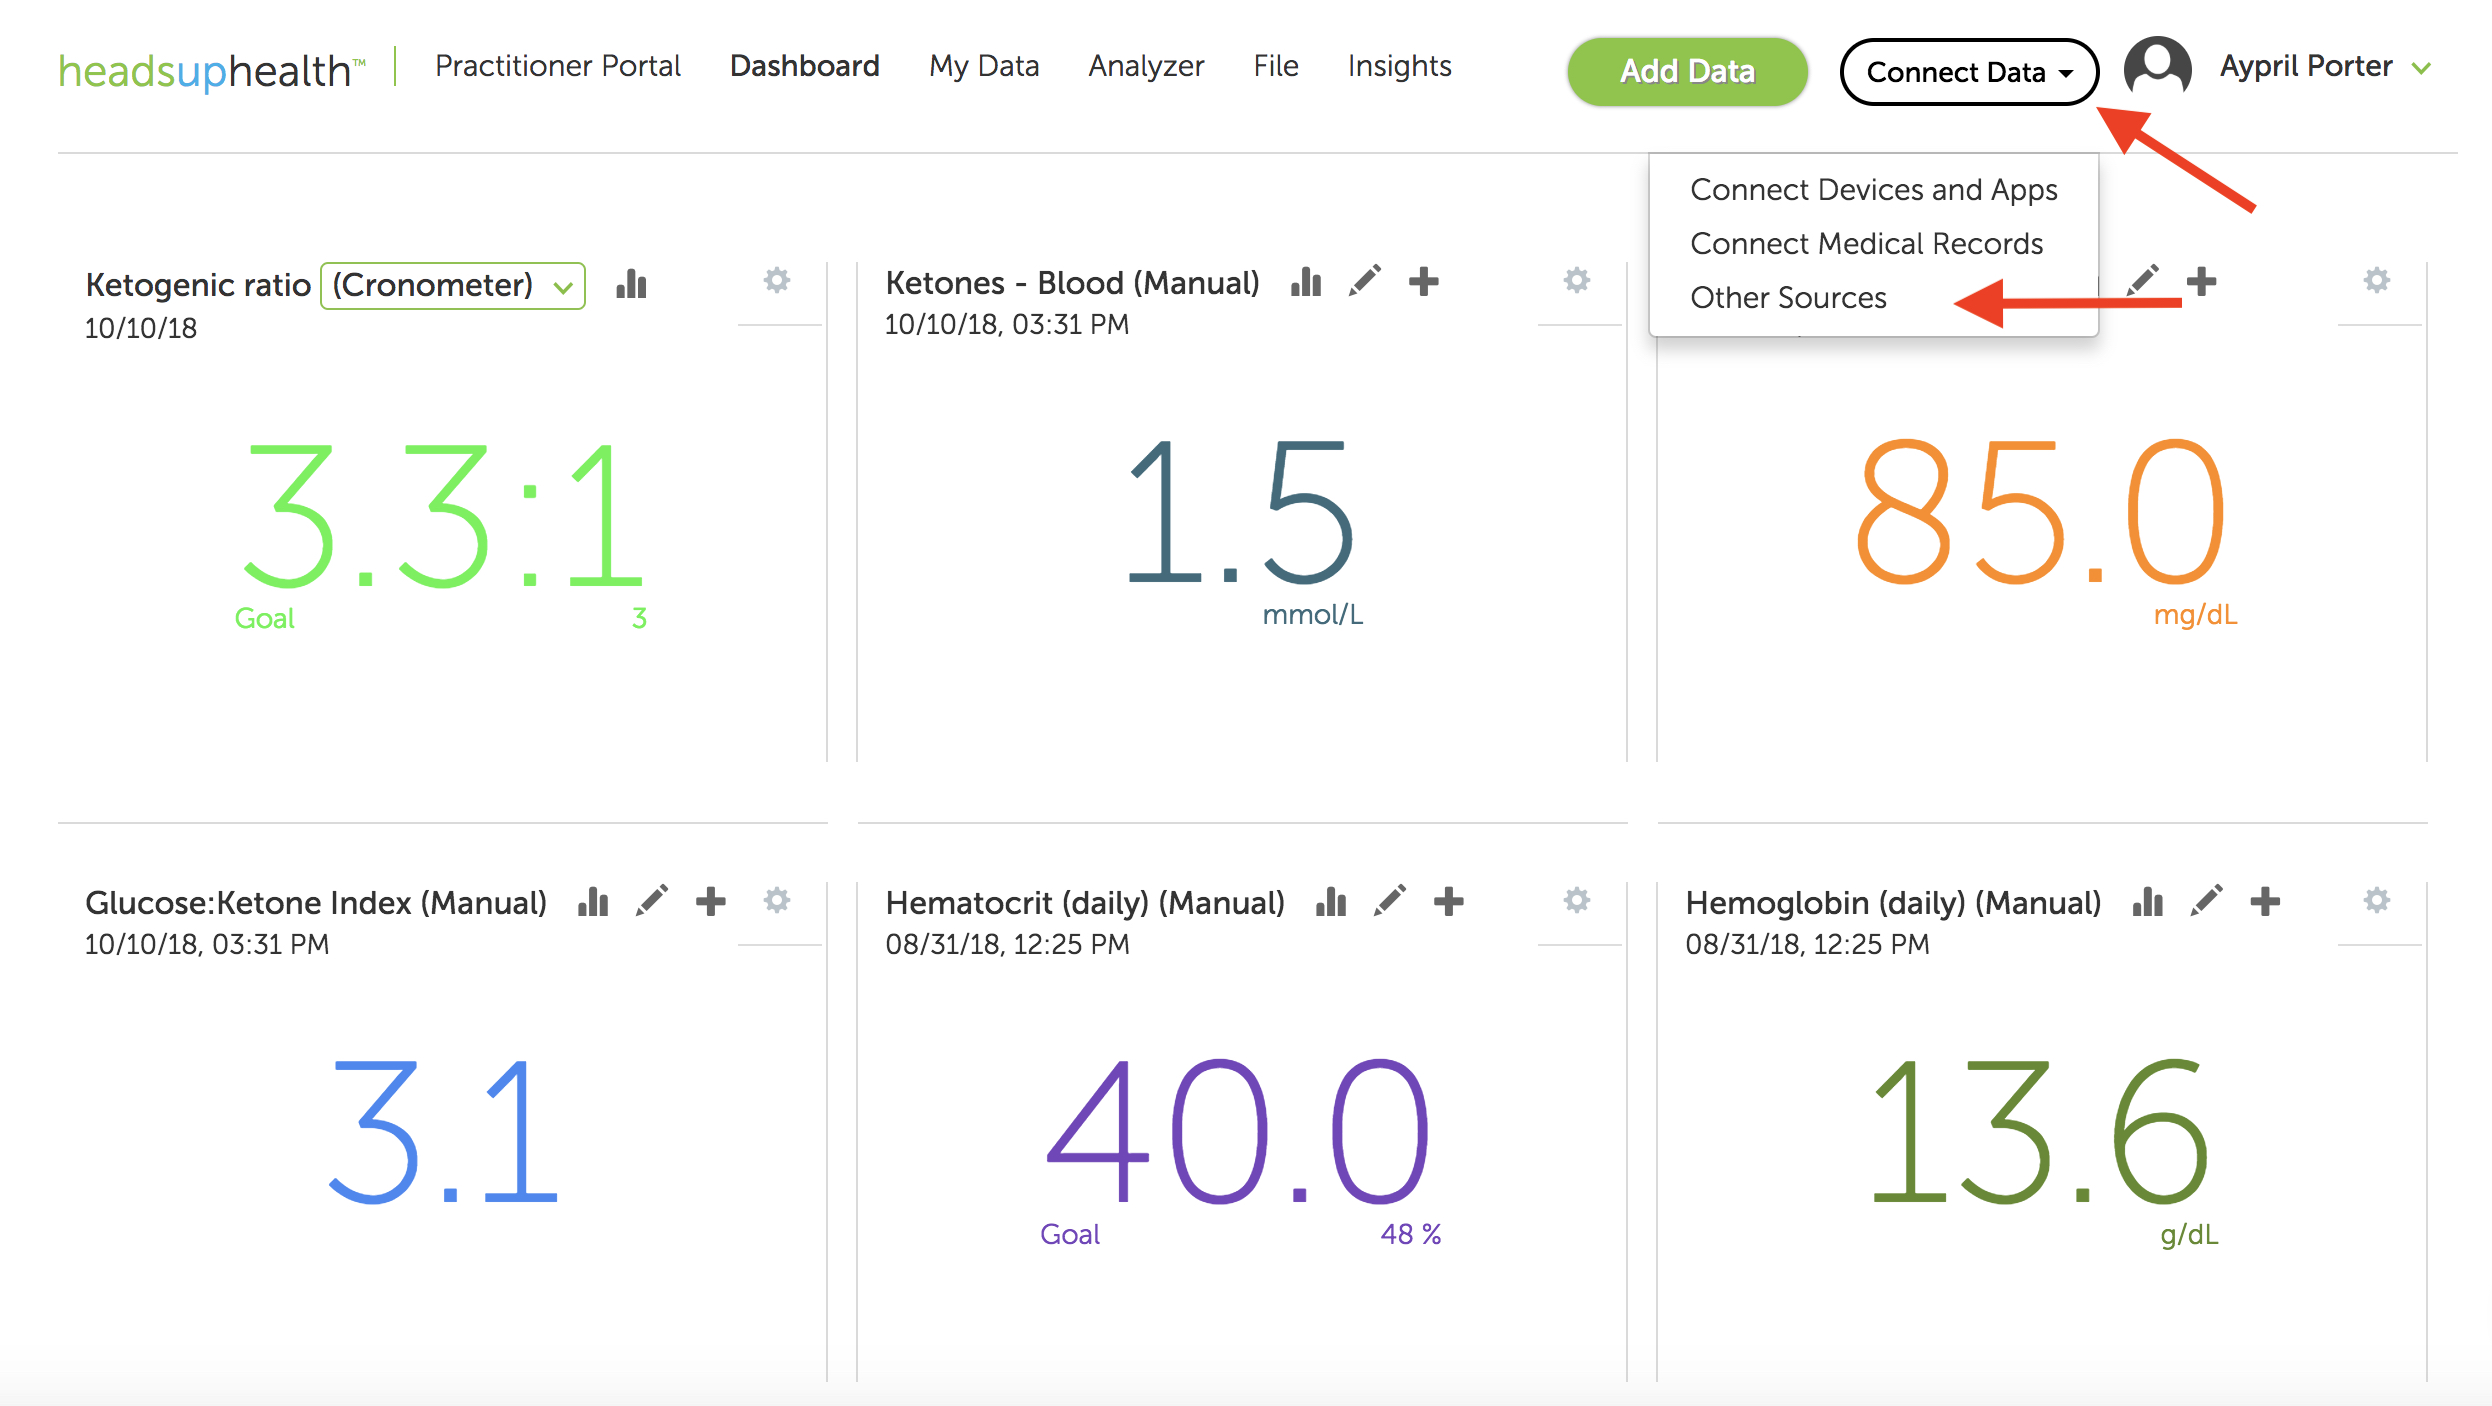
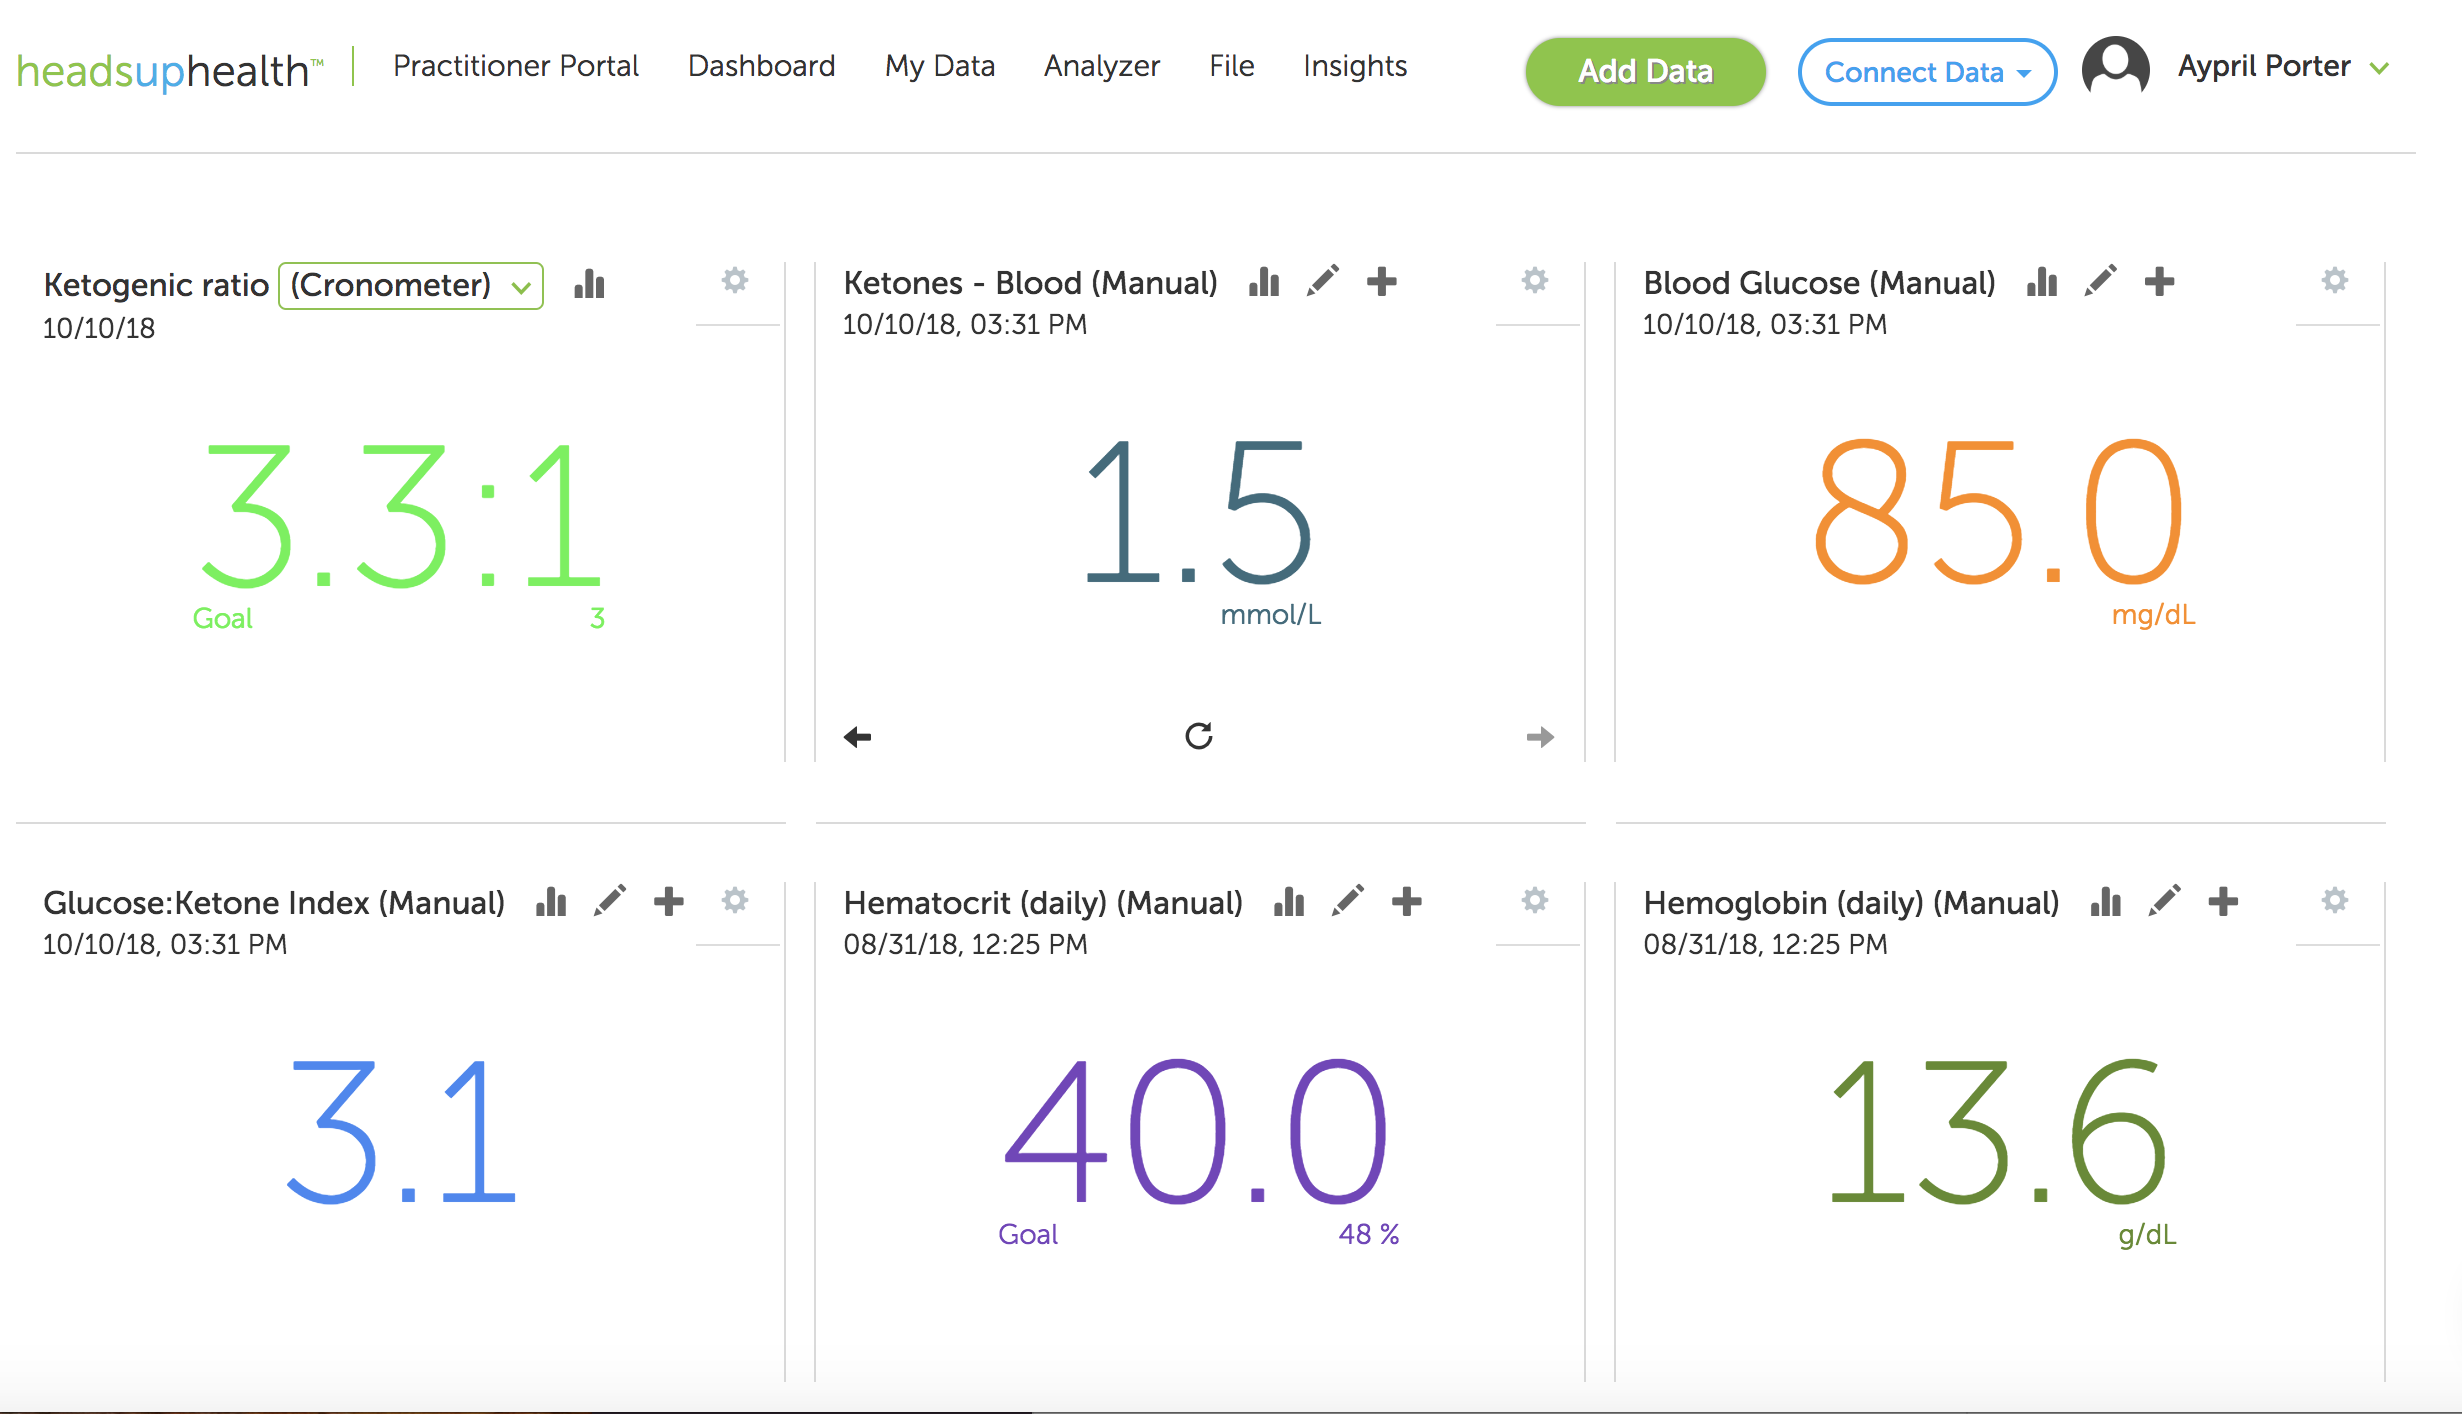
Click on “Connect Data” in the upper right corner of the page near your name.
Once you’ve gotten your food tracker connected and your keto ratio widget on your dashboard, rearrange them in a way that makes sense for you at a glance. Here is an example of how yours could look.
References:
For more detailed information on the therapeutic use of the ketogenic ratio and how it’s used in epilepsy treatment visit the Charlie Foundation.
Remember: this post is for informational purposes only and may not be the best fit for you and your personal situation. It shall not be construed as medical advice. The information and education provided here is not intended or implied to supplement or replace professional medical treatment, advice, and/or diagnosis. Always check with your own physician or medical professional before trying or implementing any information read here.
If you’ve been following a low-carb or ketogenic diet for a while, there’s a chance your cholesterol has gone up. And not just your HDL, but also your LDL—the so-called “bad cholesterol” (even though that’s a total misnomer). Maybe your cholesterol has actually gone sky-high, and your doctor not only wants you to start taking medication immediately, but she’s also ordered you to quit your “crazy” high-fat diet. Even if you follow some other kind of diet—Paleo, vegetarian, low fat, or no special plan at all—maybe your cholesterol is high, and you’ve been told you need medication, or that you should exercise more.
Your doctor is only looking out for your best interest, but if they’re not up on the latest research, they might not know that your cholesterol level tells you very little about your risk for cardiovascular disease or a heart attack:
There’s “a growing volume of knowledge that challenges the validity of the cholesterol hypothesis and the utility of cholesterol as a surrogate end point.” (DuBroff, 2017)
It’s possible to have low cholesterol but massive heart disease, or to have very high cholesterol but be in great cardiovascular shape.
If you don’t want to start a war with your doctor, but you also don’t want to abandon a way of eating that’s helped you lose weight, have more energy, and maybe even reduce or eliminate diabetes medications, you can experiment with lowering your cholesterol by using the Feldman Protocol, which we featured here at Heads Up Health. But there’s a much better way to evaluate your cardiovascular health than just looking at cholesterol. It’s called the coronary artery calcium test (CAC). We’ll explore it in detail in a bit. First, let’s look a little closer at the problems with using cholesterol as an indicator of heart health.
Cholesterol is Protective
Evidence continues to build that cholesterol levels—including LDL—are not accurate indicators of cardiovascular disease risk, and that the medical community as a whole may have gotten “the cholesterol story” very wrong. For starters, there’s the inconvenient truth that many people who have heart disease or experience a heart attack have “normal” or even low cholesterol. Low cholesterol is no guarantee against a heart attack, nor is high cholesterol a one-way ticket to heart disease and sudden death.
In fact, evidence suggests that higher cholesterol—again, including LDL—may actually be beneficial, especially in your golden years. A growing body of research indicates that high LDL cholesterol (LDL-C) is inversely associated with mortality in most people over sixty years of age. Inversely associated means, the higher the LDL, the lower the risk for mortality. To be fair, everyone’s risk for mortality is 100%, at least so far as we know. So when we say there’s a lower risk for mortality, it means that someone has a smaller chance of dying from anything other than a nice old age. This finding—that high LDL seems protective in some ways—has given researchers “reason to question the validity of the cholesterol hypothesis.”
Cholesterol is a surrogate indicator. It’s a measurement, not an illness. Neither high total cholesterol nor high LDL-C, in particular, is a disease, in and of itself. They have long been considered markers for cardiovascular disease or risk of heart attack, but this ignores the crucial fact that neither the number of LDL particles in your blood nor the amount of cholesterol carried in them indicates anything about the degree of atherosclerotic plaque built up in your major arteries.
Measuring the amount of cholesterol in your blood provides no informationwhatsoever about the accumulation of calcified plaques in coronary arteries—that is, how “clogged” your arteries are—or are not. With this in mind, the obsessive focus on lowering cholesterol by any means necessary may have actually worsened the very epidemic of heart disease these treatments were intended to stop. The authors of one paper made a powerful case that “the epidemic of heart failure and atherosclerosis that plagues the modern world may paradoxically be aggravated by the pervasive use of statin drugs,” and proposed “that current statin treatment guidelines be critically reevaluated.”
Bottom line: statin drugs do lower cholesterol, but having lower cholesterol doesn’t guarantee protection against heart attack or heart disease. Plus, statins don’t just lower cholesterol. The biochemical mechanism by which they do so comes along with a host of other effects, some of which have drastic implications for cardiovascular health. To name just two, statins interfere with healthy mitochondrial function and also impair the synthesis of crucial vitamin K2. Vitamin K2 is a “traffic cop” for calcium: it helps deposit it where it belongs, like in your bones and teeth, and helps steer it away from places you don’t want it, like your artery walls, your joints, and your kidneys. So you can see how a deficiency in this critical vitamin could lead to arterial calcification, and it has nothing to do with the amount of cholesterol in your blood. (You can learn more about this fascinating but underappreciated vitamin in the book, Vitamin K2 and the Calcium Paradox.)
Enter the CAC Test
Since people who have heart disease or suffer heart attacks run the gamut from low cholesterol to high cholesterol and everything in between, using total cholesterol or even LDL as the determinant of whether someone’s at risk for a cardiovascular event is as misguided as gauging metabolic health and carbohydrate tolerance solely through measurements of blood glucose, while ignoring the crucial role of insulin.
With all this in mind, more physicians are taking advantage of the coronary artery calcium scan. Unlike serum cholesterol measurements, which, again, are only surrogates, the CAC provides direct observation of arterial calcification that has already occurred. Not atherosclerosis an individual might or might not be at risk for based on their cholesterol, but the actual disease in progress. Why rely solely on surrogates when you can have a picture of the actual state of your arteries?
Data is accumulating that confirms what many doctors already know, even if they’re hesitant to admit it: cholesterol levels often don’t correlate with atherosclerosis. Data show that “significant ASCVD [atherosclerotic cardiovascular disease] risk heterogeneity exists among those eligible for statins according to the new guidelines. The absence of CAC reclassifies approximately one-half of candidates as not eligible for statin therapy.” In plain English: half the people who would be put on statins based on cholesterol measurements were not candidates for these potentially dangerous drugs when their actual coronary artery calcification was measured.
Other studies bear similar findings. According to a study in Korean adults, over 50% of individuals for whom statin therapy was recommended had a CAC score of zero – no calcification. Based on actual arterial calcification—or, rather, the lack thereof—these individuals were at low risk for cardiovascular events, but without having gotten the CAC test, they might have been treated with statins based solely on the surrogate measurement of LDL.
What about the other side of this? What about people with normal or even “low” cholesterol? Does that go hand-in-hand with low risk for a cardiovascular event?
Not quite. Just as people with high cholesterol might have little to no arterial calcification, people with normal or low cholesterol could have high CAC scores and be at greater risk for heart disease, heart attack, or sudden death. This exact scenario played out in a study of CAC in low-risk women—low-risk, meaning they had cholesterol in the conventionally “normal” range: “Among women at low ASCVD risk, CAC was present in approximately one-third and was associated with an increased risk of ASCVD and modest improvement in prognostic accuracy compared with traditional risk factors.” Plain English translation again: one-third of women assessed to be at low risk for atherosclerosis already had measurable arterial calcification. Say it with me for emphasis, folks: the amount of cholesterol in your bloodstream tells you nothing about the amount of atherosclerotic plaque in your arteries.
And the reason to measure the extent of calcified plaque is that these plaques can rupture, break away from the artery wall, and block the artery, cutting off blood flow to the heart—which is one-way heart attacks happen.
If you’re wondering why calcium might end up in your arteries, the main reason is that it’s one of the ways your body repairs damaged blood vessels. According to Ivor Cummins and Jeffry Gerber, MD, in their book, Eat Rich, Live Long:
“The body’s response to damaged coronary arteries is always the same, and that response is what the CAC scan directly observes and quantifies. Your body tries to repair itself by depositing calcium in the damaged areas of the arterial wall. As the damage continues, these repair processes quicken. They desperately attempt to shore up the arterial walls before a rupture occurs. This growing calcium becomes the telltale sign of imminent danger—the ultimate canary in the coal mine.”
What is the CAC Test?
The CAC test, also called a “heart scan,” is a non-invasive, special x-ray of the heart and coronary arteries, performed via CT scan (computerized tomography). The scan itself takes only 20-30 seconds, but the whole procedure, from start to finish, takes about 10-15 minutes. Fasting is not required, but you may be asked to refrain from smoking or consuming caffeine for four hours before the scan, since an elevated heart rate can reduce the image quality. Many insurance companies cover this test, but if yours doesn’t, or your doctor won’t order one for you, you can pay for it out of pocket, for about $150 in the U.S.
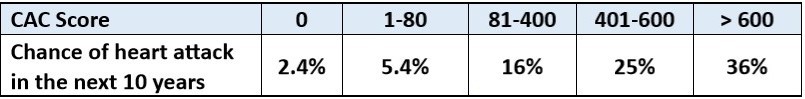
Test results are usually given as a number called an Agatston score. This number reflects a composite measurement of the total area of calcium deposits, and the density of the calcium. According to the Mayo Clinic, a score of zero means no calcium is present, and risk of heart attack is low. When calcium is present, the higher the score, the higher the risk for heart attack in the long term. A score of 100 to 300, considered “moderate plaque deposition,” is associated with a high risk of heart disease or heart attack over the next three to five years, and a score over 300 indicates very high to severe risk.
The key thing to know here is, many people (especially low-carbers) have very high cholesterol, but CAC scores of zero. Even if your score isn’t zero, if it’s very low, that might put your doctor’s fears to rest even if you have high cholesterol. Keeping the peace with your doctor isn’t a bad reason to have a CAC test, but an even better one is to put your own mind at ease.
The exact meaning of different coronary calcium scores differ depending on the source cited, but here’s a general guide, according to Axel Sigurdsson, MD:
Coronary calcium score 0: No identifiable plaque. Risk of coronary artery disease very low (<5%)
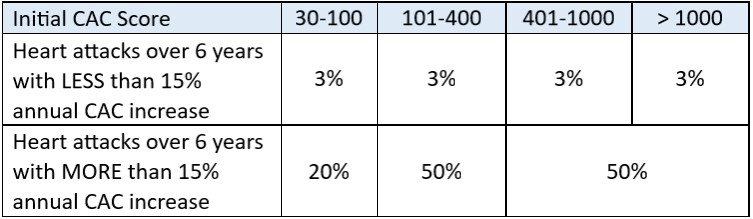
However, a high CAC score doesn’t mean you’re automatically in imminent danger. If your plaques are stable—that is, they don’t keep increasing over time—your risk for a cardiovascular event remains pretty low. On the other hand, even if you start out with a relatively low score, if that score increases substantially over time, your risk is much higher. Remember, as arterial damage worsens, calcium deposition increases, so if your CAC score is going up, your arteries are in worse shape.
From Eat Rich, Live Long:
Track Your Progress
The Heads Up Health app is the perfect place to track your Coronary Artery Calcium scores. See the video below for more information:
Not a Perfect Test
Although a low CAC score generally indicates a low risk for cardiovascular events or disease, it’s not a full guarantee. Unstable coronary plaques vulnerable to rupture may be present in the absence of calcium deposition. And a high CAC score increases the chances that you have vulnerable plaques, but it doesn’t identify specific places where a rupture or blockage might occur. Dr. Sigurdsson wrote:
“The presence and extent of coronary calcium are first and foremost markers of the extent of atherosclerosis within the coronary arteries. Nonetheless, it is important to understand that the coronary calcium score does not necessarily reflect the severity of narrowing (the degree of stenosis). Still, a patient with a high calcium score is more likely to have a significant narrowing of a coronary artery than a patient with a low calcium score. An individual without coronary artery calcification is very unlikely to have a severe narrowing of a coronary artery. Although cardiovascular events can occur in patients with very low calcium scores, the incidence is very low.”
Not only can you slow the progression of arterial calcification, but you can actually reverse it. This was virtually unheard of in the past, but that’s because the only things recommended to people with high CAC scores was a low-fat diet and cholesterol-lowering medications. Since coronary artery calcium has virtually nothing to do with your cholesterol and a lot more to do with repairing damage to blood vessels injured by chronically high glucose and insulin, it’s no wonder a high-carb diet and cholesterol medications made no impact.
On the other hand, a ketogenic or low-carb, high-fat diet might be just the thing to help those blood vessels heal and restore your cardiovascular system to its best functioning. Use the tracking system here at Heads Up Health to record your CAC score and keep track of all your other health data in one convenient place.
In many people, high insulin (hyperinsulinemia) is the primary driver of chronic metabolic illness, even when blood glucose is normal. For people concerned with achieving and maintaining optimal health, few things are more important than healthy gluco-regulation—that is, your body’s blood glucose and insulin levels, and how they respond to the foods you eat. Here at Heads Up Health, we’re committed to helping you realize your health goals. Past posts on our blog have explained how to interpret various lab tests for people on low carb diets, such as fasting glucose and hemoglobin A1c. We emphasized that besides just measuring your glucose, it’s imperative to keep track of your insulin levels. Fasting insulin is the most important test most doctors don’t even order.
Another measurement, called HOMA-IR, is the relationship between your fasting glucose and insulin—it tells you how much insulin your body needs in order to keep your blood glucose at a certain level. Because it factors in insulin and not just glucose, HOMA-IR is often a better indicator of metabolic status than glucose alone. But what should you do if your fasting insulin level is normal, but you think you have signs and symptoms of chronic hyperinsulinemia? Is this even possible? Can you have a normal fasting insulin level but have high insulin at other times? Yes! Enter the Kraft test.
What’s the Kraft Test?
If you’ve never heard of the Kraft test, don’t worry; you’re not alone. It’s not a well-known test in conventional medicine, but it’s gaining popularity among doctors who use low carb and ketogenic diets with their patients. If you’re familiar with the oral glucose tolerance test (OGTT), the Kraft test is a variation on it. In case you don’t know what the OGTT is, let’s start there.
The OGTT is typically used to diagnose type 2 diabetes or gestational diabetes (diabetes during pregnancy). It measures your body’s glucose levels in response to 75 grams of liquid glucose. It’s performed in a lab or a doctor’s office, and it starts off with a baseline or fasting glucose measurement. After that sample is taken, you drink the glucose solution, and then your blood glucose is measured one and two hours later. (Occasionally some labs will include tests at the 30 and 90-minute marks as well.)
The Kraft test goes beyond the standard OGTT in two ways:
It measures insulin along with glucose
Instead of only two hours, the test is extended to five hours
With these two small changes, the Kraft test gives you a staggering amount of information you won’t get from the standard OGTT.
Why’s it called the Kraft test? Well, the man who created it was Joseph Kraft, MD. It can also be called an “oral glucose tolerance test with insulin assay,” but in the low carb community, it’s usually referred to as the Kraft test, to honor the man whose work was some of the earliest in uncovering the detrimental effects of chronically high insulin.
By including insulin measurements and extending the test to five hours, what Kraft discovered was nothing short of mind-blowing. As he wrote in his book, Diabetes Epidemic & You, “There are far too many who are told, ‘Don’t worry, your fasting blood sugars are normal.’” And indeed, many people do have normal fasting blood sugar, but that’s only thanks to sky-high insulin. (HOMA-IR can help identify this situation.) And what if your fasting sugar and fasting insulin are both normal, but you suspect your unresolved health issues could be due to high insulin at other times of the day? This is where the Kraft test shines.
To describe the situation of normal glucose with high insulin, Dr. Kraft coined the phrases diabetes in-situ, and occult diabetes—occult meaning “hidden”— diabetes (that is, the high glucose) is hidden, or masked, by the high insulin. And as we explained in the Heads Up Health post on fasting insulin, even when glucose is normal, chronically high insulin is a major contributor to abdominal obesity, gout, hypertension, PCOS, skin tags, and more. And remember—the official diagnostic criteria for type 2 diabetes are based on glucose measurements alone, not insulin!This is why quite literally millions of people with diabetes in-situ remain undiagnosed, and their medical care team fails to connect hyperinsulinemia to the issues they’re dealing with–because they’re not testing insulin.
The Kraft test shows you your glucose and insulin responses to an oral glucose load. Here’s how it works:
Kraft’s original tests called for 100 grams of glucose solution, but some doctors may use 75 grams. Just as with the standard OGTT, your baseline glucose and insulin levels are recorded via fasting levels. You consume the liquid glucose, and then your glucose and insulin are both measured at the 30-minute mark, and then again at one hour, two, three, four, and five hours.
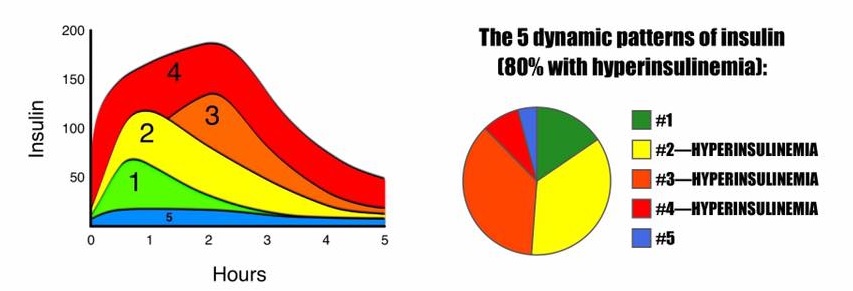
Kraft identified five distinct patterns of elevated insulin:
Image courtesy of Theodore Naiman, MD
Pattern 1 – Metabolically healthy: In response to a glucose load, the insulin level rises quickly, but moderately, and it comes back down relatively quickly. Fasting insulin and glucose levels are normal, and the peak insulin level is reached at about 30 minutes. By about 3 hours later, it’s back to baseline. Glucose and insulin responses are both normal.
Pattern 2 – Delayed insulin peak: In response to a glucose load, the insulin level rises quickly, but it rises higher than that for the healthy person in pattern 1. Fasting insulin level is normal, and the peak level is reached at 30-60 minutes. In addition to rising higher, insulin takes longer to come back down, not returning to baseline until about 4-5 hours after. Glucose response is normal, but insulin is elevated higher than normal, and it remains elevated for a prolonged amount of time. This pattern indicates hyperinsulinemia.
Pattern 3 – Delayed insulin peak: In response to a glucose load, insulin rises even higher than the already hyperinsulinemic example in pattern 2, but it doesn’t reach its peak until even later. Fasting insulin is normal, but the peak level isn’t reached until the 2 or 3-hour mark. This is a delayed peak, and it takes even longer to come back to baseline. Glucose response may be normal or at diabetic levels; insulin is elevated higher than normal, and it remains elevated for a prolonged amount of time. This pattern indicates hyperinsulinemia.
Pattern 4 – Insulin Resistance: Fasting insulin level is elevated (>10 μU/mL). In response to a glucose load, the already elevated baseline insulin level, skyrockets, takes a very long time to come back down, and when it does eventually come down, it comes down only to the baseline, which was already abnormally high. Glucose response is usually at diabetic levels. This pattern is diagnostic for insulin resistance.
Pattern 5 – Insulinopenic (low insulin): Fasting insulin is very low. In response to a glucose load, insulin barely budges, but glucose reaches diabetic levels (possibly as high as ≥300mg/dL). All tested values for insulin over the five hours are <30 μU/mL. When all insulin measurements are low and glucose is elevated, this pattern is suggestive of type 1 diabetes.
Some people who’ve been following a long-term low carb or ketogenic diet will show pattern 5, low insulin. When insulin measurements are low and glucose is also low, this is not considered pathological. (It’s only a problem when glucose is high.) This is known to occur in some long-time low carbers.
BUT: it’s been suggested that people who’ve been following a low carb or ketogenic diet for a while should “carb-up” for a week or so to prepare for an OGTT or Kraft test. They should consume about 100-150 grams of carbohydrate for several days in order to get their body re-acclimated to metabolizing a significant amount of carbohydrate. Without this readjustment period, there’s a risk of getting a false result—of appearing to have extremely elevated insulin and/or glucose, when it’s really just that the body isn’t accustomed to dealing with a big wallop of glucose all at once.
Should You Do a Kraft Test?
If you’re satisfied with the results you’re getting from your diet and lifestyle, there isn’t much of a pressing reason to do the Kraft test. (After all, why would you want to drink 75+ grams of liquid glucose, even if you’re not on a low-carb diet?) Also, there are other indicators that, taken together, can tip you off as to whether your insulin levels are chronically elevated (such as high triglycerides, low HDL, and a high waist-to-height ratio).
But if you feel like you’ve been doing everything right, yet you’re still dealing with signs & symptoms of a condition that’s known to be driven primarily by high insulin, it might be worth it to see your glucose and insulin in action—especially if your fasting levels for both are normal.
We use cookies to ensure that we give you the best experience on our website. If you continue to use this site we will assume that you are happy with it.I consentView Privacy & Cookie Policy


 The CAC test, also called a “heart scan,” is a non-invasive, special x-ray of the heart and coronary arteries, performed via CT scan (computerized tomography). The scan itself takes only 20-30 seconds, but the whole procedure, from start to finish, takes about 10-15 minutes. Fasting is not required, but you may be asked to refrain from smoking or consuming caffeine for four hours before the scan, since an elevated heart rate can reduce the image quality. Many insurance companies cover this test, but if yours doesn’t, or your doctor won’t order one for you, you can pay for it out of pocket, for about $150 in the U.S.