Heat therapies have long been used for healing and wellness, dating all the way back to the ancient Greeks, Romans, and Mayans. The sauna is simply a small or large room designed specifically to help you sweat. What’s more, science stands behind saunas, and modern medicine has proven 10 clinical health benefits of saunas that will leave you wanting to get your own sweat on soon.
Different Types of Saunas
Today, saunas are an everyday part of many cultures, from the Finnish outdoor saunas to the Swedish batsu, the Korean jjimjilbangs, and Japanese sento. Variations of the dry and steam (or wet) saunas, as well as the latest infrared saunas, all offer a variety of health benefits, even after only a few minutes a day of use. Users report that a deep, healthy sweat generally relieves stress, reduces muscle tension, and delivers an overall sense of relaxation and well-being.
Over the ages, various types of dry and wet saunas have been invented, along with the latest infrared saunas that deliver direct heat to the body versus heating the air and room temperature.
Here’s a look at the types of saunas to consider as you evaluate incorporating them into your health regimen:
Dry saunas are heated with fire, hot stones, gas, or electricity
Steam saunas generate steam by applying water on the heating element
Infrared saunas use infrared heaters to emit light that delivers radiant heat that’s absorbed by the surface of the skin
Hybrid Saunas – Use combinations of Dry Saunas, Steam Saunas, or Infrared Saunas.
Infrared saunas are further broken down into the following types:
Near infrared saunas
Far infrared saunas (FIR)
Full spectrum infrared saunas
Infrared saunas deliver direct heat via the infrared light and at lower temperatures versus dry and wet saunas that heat the air to increase the room temperature.
Difference between infrared and near infrared
The main difference between far infrared and near-infrared saunas is the depth and intensity of the therapy. Far infrared saunas generate a longer wavelength heat that penetrates deeper into the skin, allowing for more effective therapeutic benefits. Near-infrared saunas, on the other hand, produce short wavelengths of light which remain closer to the surface of the skin. This type of sauna can still provide great results but is not as intense or therapeutic as far infrared.
Differences between full-spectrum saunas and infrared saunas
The main differences between full-spectrum saunas and infrared saunas are the type of heat used, the intensity and depth of therapeutic benefits, and their ability to detoxify. Full-spectrum saunas use both near-infrared and far-infrared light to produce heat, while infrared saunas only use infrared light. This gives full-spectrum a more intense and beneficial therapeutic experience than just far infrared alone. Additionally, full-spectrum saunas can help to release chemicals from fat cells through sweating, whereas infrared saunas don’t have this same detoxifying effect.
What Happens in the Body?
Whatever type of sauna therapy you choose, and regardless of the humidity level, the effects on the body are similar and create a variety of well-documented health benefits, such as releasing the ‘feel good’ endorphins, in addition to widening the blood vessels to improve circulation and blood flow.
Depending on the duration of sauna use, you will see circulation improvements that are similar to the effects of moderate exercise. Your heart rate may increase to 100 to 150 beats per minute while the growth hormone release increases by as much as 200 to 300%. Sauna use can also help improve athletic performance and stamina due to that increase in circulation.
Still not convinced? Then let’s dive into a few more proven health benefits of sauna use, and how to accurately measure the effects.
10 Proven Clinical Health Benefits of Sauna Use
1. Supercharge your cell power. Heat has been proven to positively impact your mitochondria, the ‘batteries’ powering your cells, helping your body naturally produce more energy and stay fit.
3.Detoxify heavy metals and chemicals. Everyday exposure to potentially toxic heavy metals through a variety of sources means even the most health conscious people still have toxins in the body. Regular sauna bathing helps excrete toxins such as arsenic, cadmium, lead, and mercury.
4. Make your heart happy and healthy. A 2018 study found that sauna bathing four to seven times per week reduces the risk of death from cardiovascular disease by as much as 58%.
5. Reduce blood pressure. Sauna heat helps widen blood vessels and improve circulation, which reduces blood pressure.
6. Optimize athletic performance. Blood flow improvements from hyperthermic conditioning (heat conditioning) sends more blood to the heart, leading to an increase in plasma and red blood cell volume. That process delivers more oxygen throughout the body, fueling athletic performance.
7. Improve muscle function and recovery. As more blood flow and oxygen is delivered throughout the body, muscles increase in size and muscle breakdown is diminished. One study showed that two, one-hour sauna sessions for seven days straight increases production of the human growth hormone (HGH) by two to five times.
8. Fuel weight loss. Regular sauna use is shown to regulate the appetite, increase metabolism, and improve oxygen utilization, helping to fuel weight loss along with a reduction in body fat.
9. Boost brain function. The brain-derived neurotrophic factor, or BDNF increases with regular sauna use, activating the growth of new brain cells, better maintaining existing cells, and improving neuroplasticity, the brain’s process for forming new neural connections.
10. Ignite your immune system. Heat exposure from sauna use increases the heat shock protein, stimulating antigen-presenting cells, along with releasing cytokine, thus stimulating the body’s natural immune system.
11. BONUS BENEFIT: improve emotional health and mood. When your body and brain are healthy, detoxified, and destressed, and you’ve boosted endorphins, your overall mood and emotional health improves.
Who Should Sauna, and Who Shouldn’t…
Due to the extreme heat, certain people should avoid sauna use of any type, including pregnant women and those with specific health conditions such as low blood pressure and heart conditions. As with anything, it’s always wise to consult your medical practitioner before beginning sauna treatments.
How to Track Your Personal Sauna Health Benefits
Everyone is unique and may have very different outcomes from sauna use, so track your key metrics before and after use, as well as over a period of time, to understand specifically how sauna use is impacting you.
For example, the Heads Up app gives you a way to enter the type of sauna you’re using, the room temperature, date, and duration. From there, you can check health stats such as blood pressure, heart rate, and more. You may even see improvements in the quality of your sleep over time.
How to Track Your Client’s Sauna Sessions, Treatments, Outcomes, and more!
Heads Up Health is a useful tool for healthcare professionals who want to track their client’s sauna sessions, treatments, and outcomes. This comprehensive system allows users to store detailed records of their patient’s health data and easily access it with the click of a button. This includes information such as sauna session length and frequency, infrared heat temperatures used, notes from treatments and outcomes, and more. By using Heads Up Health, healthcare professionals can keep an accurate record of their client’s progress and make sure they are receiving the best possible care.
Ready to get started?
If you’re ready to ‘dive into’ sauna bathing of any kind, grab a 30-day free trial of Heads Up first and decide on some of your goals for sauna use, then monitor your key health metrics before and after. You may also want to monitor various durations and frequencies, and the correlated effects on those same metrics to determine which type of sauna and frequency level is right for you. And as we always say, be sure to consult your health practitioner before starting any new health regimen!
Are You A Health Professional?
Do you want to track your patients Sauna sessions or other treatments along with their health metrics like weight, HRV, glucose and more, in a beautiful dashboard to quantify the benefits of Sauna use? Click here to learn more about the health professional platform.
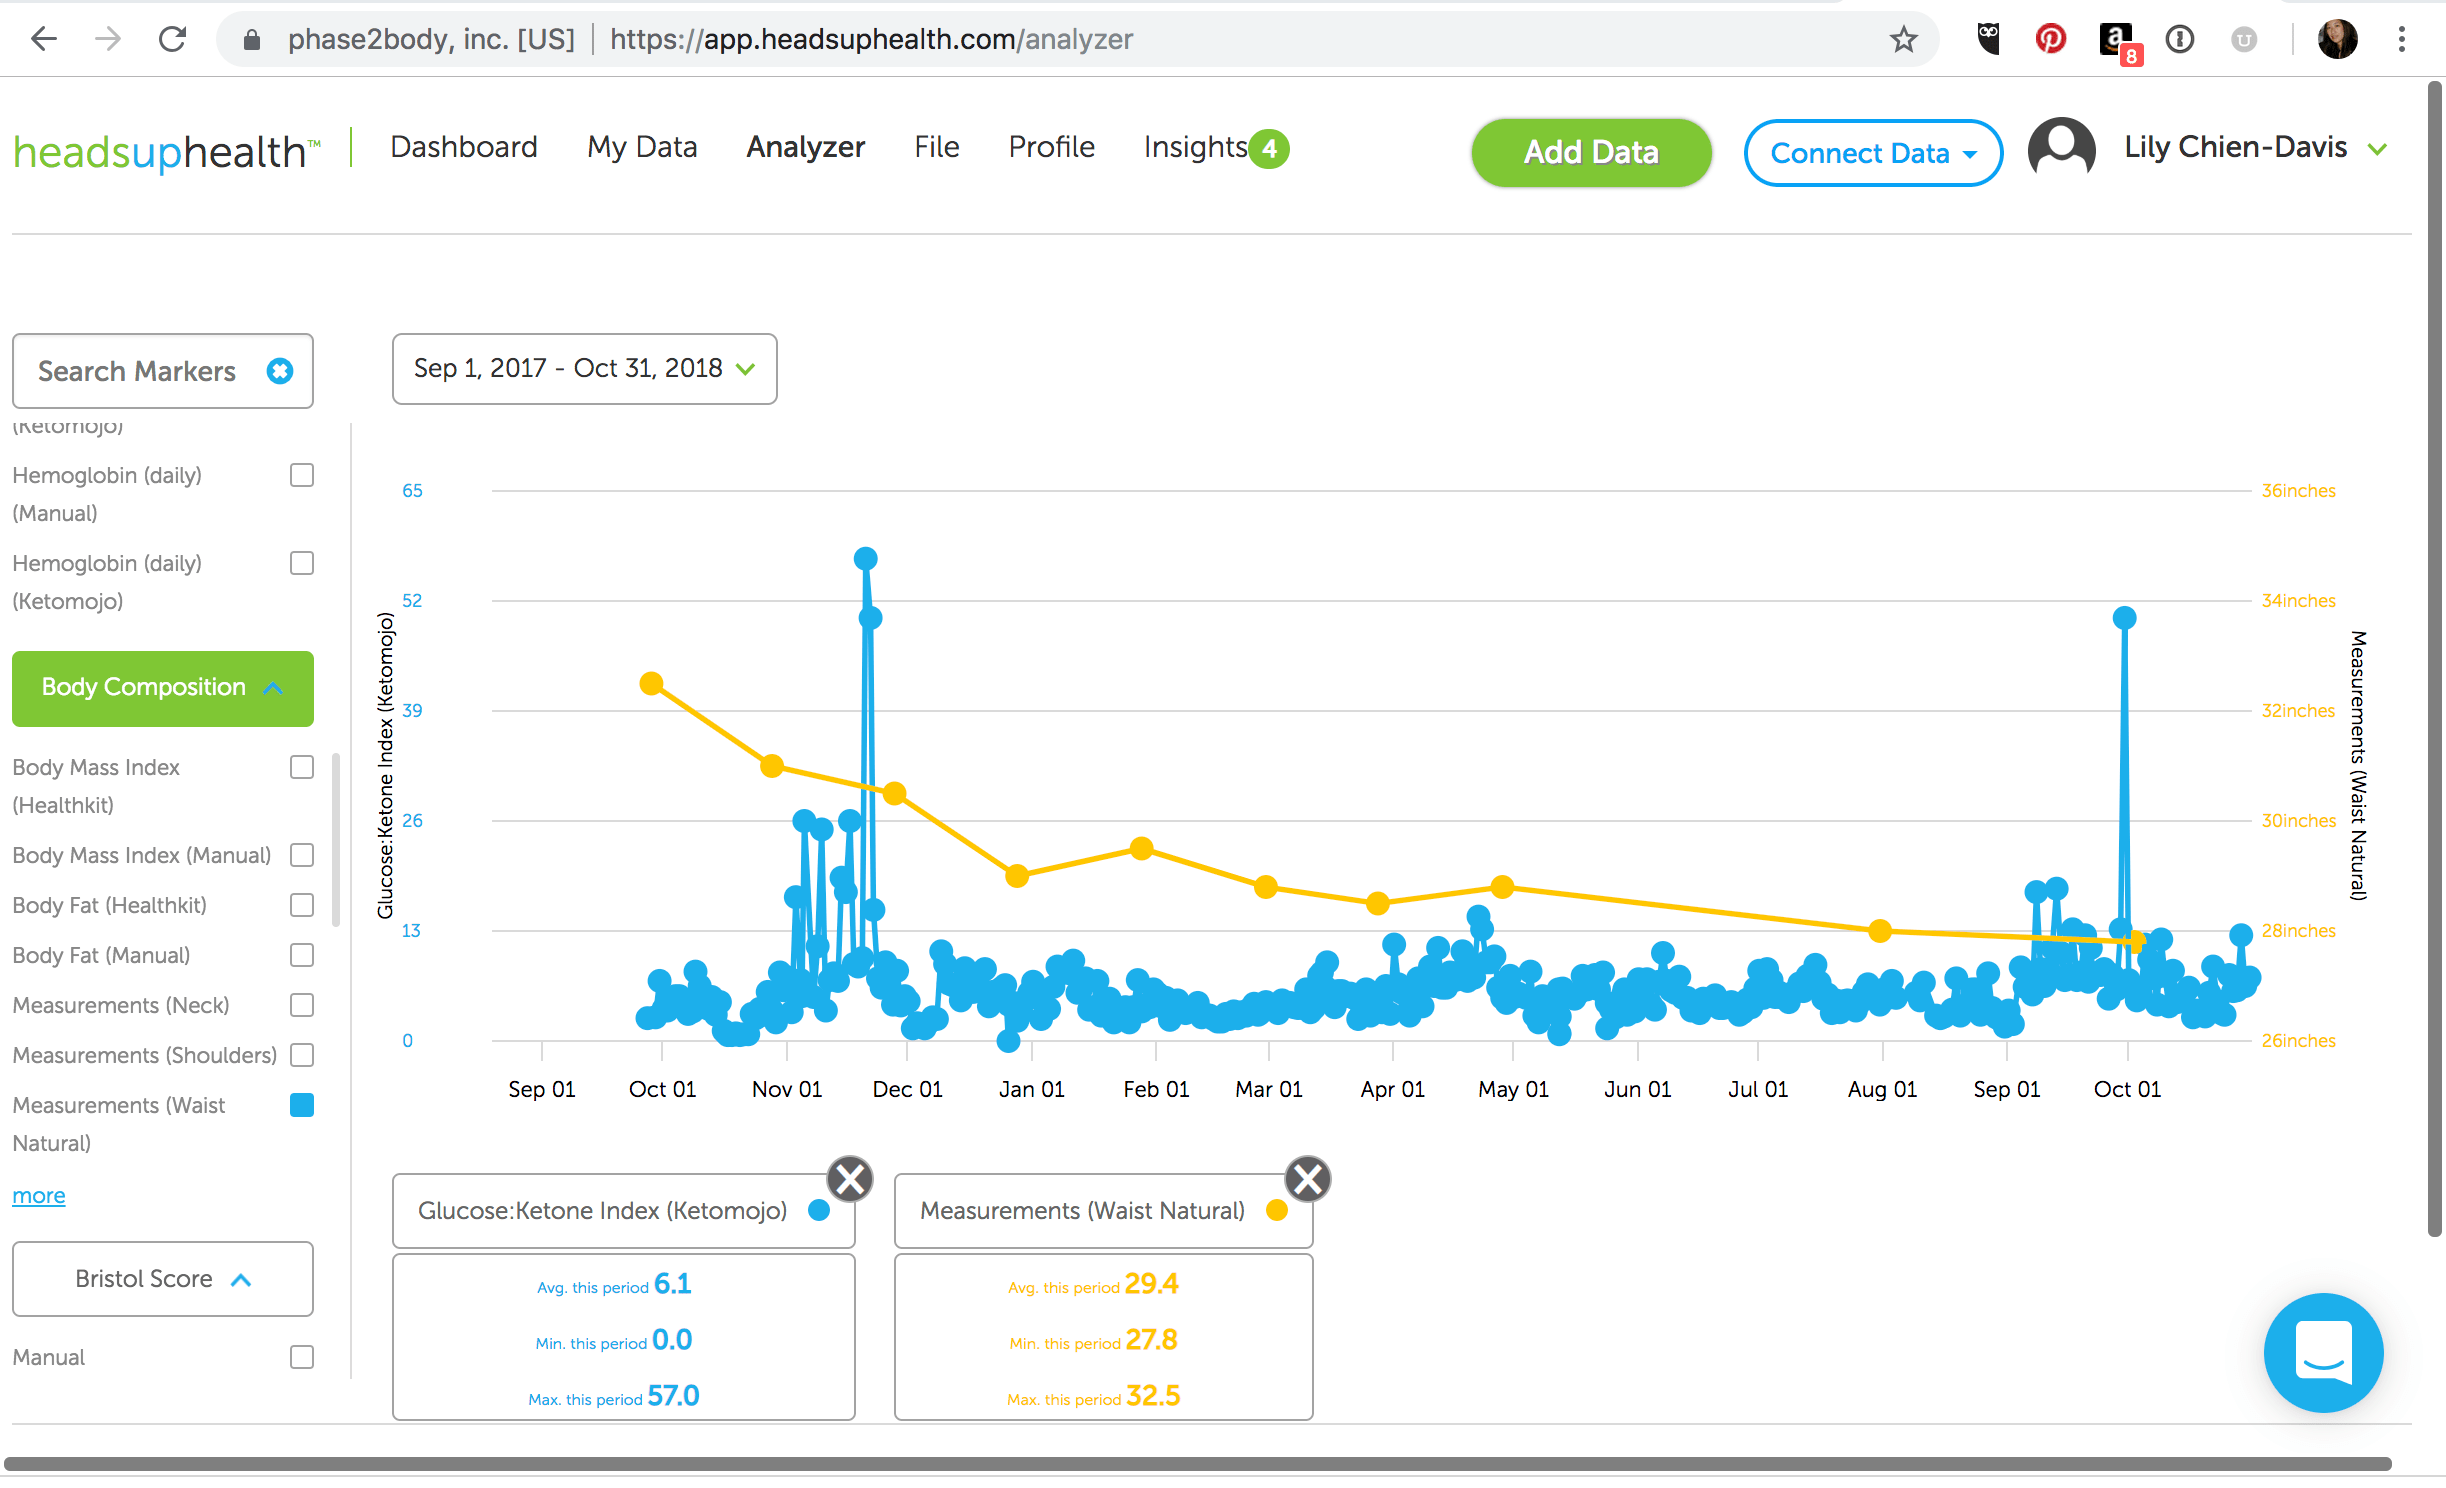
The real power in using Heads Up Health with Keto-Mojo is being able to track and correlate biomarkers you care about, such as the GKI (Glucose Ketone Index) with other major health metrics, like body measurements.
The leader in consumer software for personal health data analytics, Heads Up Health allows you to see your progress over weeks, month, years — all in one place. When used together with Keto-Mojo, the leader in affordable, accurate blood glucose and ketone testing meters, they’re a powerful force for helping you get into ketosis, maintain keto-adaptation, and see the big picture of your metabolic health and body composition.
For example, our Social Media Manager, and avid Heads Up Health user, Lily Chien-Davis, correlated her GKI with her waist circumference measurements, whittling down her waist size while staying keto-adapted.
In the graph above, Lily shares how she used Keto-Mojo to track her glucose and ketones over the past 12 months, uploading those results to Heads Up Health where we automatically calculate the glucose-ketone index (GKI), a powerful biomarker for tracking your metabolic health.
The graph speaks for itself as Lily slashed over five inches off her waist circumference!
Lily first discovered the glucose ketones index as a biomarker when her husband was diagnosed with cancer in 2014. They used a therapeutic ketogenic diet as an adjunct to conventional treatment, consulting with Miriam Kalamian [1] and following the advice of cancer researcher, author [2] and inventor of the GKI, Thomas N Seyfried and his advice to keep the glucose ketone index low, “tracking the ratio of blood glucose to ketones as a single value”, in an effort to blast the tumors near her husband’s aorta. [3]
As they both carefully monitored his glucose ketone index and watched his tumors rapidly shrink, she began eating keto too, surprised, as someone diagnosed with pre-diabetes, to watch her own HbA1c go down, from 5.9% to 5.2%. In 2016, she discovered Heads Up Health while listening to keto podcasts (i.e., Jimmy Moore, Ketovangelist, 2 Keto Dudes). Both she and her husband immediately signed up, excited to track their glucose, ketones, and GKI alongside their medical records and body composition data, such as weight and waist size.
Since then, Lily has never looked back.
Instead of using a scale to track her weight every day, which can be maddening because weight loss is never linear, she tracks her GKI alongside her waist circumference and weight once a month using our measurements feature. In the beginning she also tracked her macros, but now relies solely on eating an intuitive keto-paleo and sometimes carnivore diet, preferring to track her GKI regularly, using the graphing feature in Heads Up Health’s Analyzer to reflect on her progress, helping her stay motivated.
Here’s Lily’s before/after photos and you can see how great she looks. Most importantly, she FEELS awesome, both mentally and physically.
“Tracking with Keto-Mojo and Heads Up Health helped me to stay in ketosis and keto-adapted for over a year, giving me accountability and motivation to keep keto-ing on. Although I’m not completely where I’d like to be just yet, I’m free of all prescription meds, happier and healthier than I’ve ever been. My husband is now almost 4 years in remission and we recently sold our house to move into, travel and worldschool our kid in a RV, a dream we hatched up during long days of chemo infusions. People say keto is restrictive, that it’s a fad diet, but because I’ve used it for mental and physical health, it’s just a way of life for me now. The rest — feeling younger, more energy to actually want to exercise, mental clarity, and better body composition — is just icing on the cake!” – Lily Chien-Davis
It takes a lot of courage to share this information so please give Lily a shout-out on Instagram (@hellbentonbliss). We love you Lily!
Written by Andrew Flatt, Dave Korsunsky and Chuck Hazzard
Overview
We’ve released an experimental feature in Heads Up Health which automatically calculates the HRV coefficient of variation (CV) based on the data from your Oura ring.
Why track HRV CV?
Looking at daily HRV readings enables you to note short-term fluctuations relative to your baseline. This can be useful for observing the effects of various stressors and lifestyle factors which can help inform on behavior-modification strategies to optimize your HRV.
Due to daily fluctuations, an isolated (i.e., single time-point) HRV measure may not truly reflect an individual’s typical HRV. Thus, some researchers and practitioners are moving towards averaging a series of daily measures to better characterize one’s autonomic activity. In turn, most HRV apps are now reporting a rolling weekly average of your HRV values.
Tracking the rolling weekly average provides a better indication of whether your HRV is actually changing in a given direction. In addition, instead of reacting to an isolated change in HRV, a more conservative and convenient approach would be to react only when the rolling average starts to change. One low HRV reading may not be of much concern and would have little impact on the weekly average. However, a series of low scores will reduce the rolling average and may indicate that it’s time to do something about it.
Along with your rolling weekly HRV average, further insight can be gained by monitoring the Coefficient of Variation (CV) among the rolling HRV values. This is because the magnitude of HRV fluctuations can change from week to week, with or without out much change in the rolling average. How much your HRV fluctuates on a day-to-day basis is quite meaningful. Large fluctuations increase the CV while smaller fluctuations lower it.
Interpreting HRV Coefficient of Variation (HRV CV) values
Typical HRV CV values range from 2 – 20%. If we were to take a random sample of adults and measure their HRV for a week, we would probably find that individuals who are younger, healthier (i.e., without disease), leaner and more aerobically fit will fall on the lower end of that range and less-healthy individuals on the higher end.
Regardless of what your CV is at a given time, it’s important to know that it can and will change. Now, whether an increase or decrease in your CV should be interpreted as good or bad is entirely context-dependent. We’ll use some practical examples to explain.
Among healthy individuals, an increased CV is typically associated with greater stress, fatigue, and lower fitness. Vice versa for a lower CV. Thus, the CV is a useful value for assessing adaptation to a new fitness program or lifestyle change. For example, unfamiliar stress will typically cause greater fluctuations in HRV (i.e., increased CV). However, as you become familiar with the new routine, there should be less fluctuation (i.e., decreased CV) which is a sign of positive adaptation. What was once quite stressful to your body is no longer as stressful.
Reductions in the CV are typically good, indicative of increasing fitness, lower stress (or improved stress tolerance) and so forth. There are exceptions, however. For example, suppose your new training program or work schedule is overbearing. Accumulating stress causes an initial increase in your CV. As things continue, your healthy eating habits start to wane, your sleep deteriorates and you become rundown. In this context, your HRV readings may become chronically suppressed, failing to bounce back to baseline. Thus, your rolling average has now decreased, as has your CV.
How we calculate Oura HRV CV
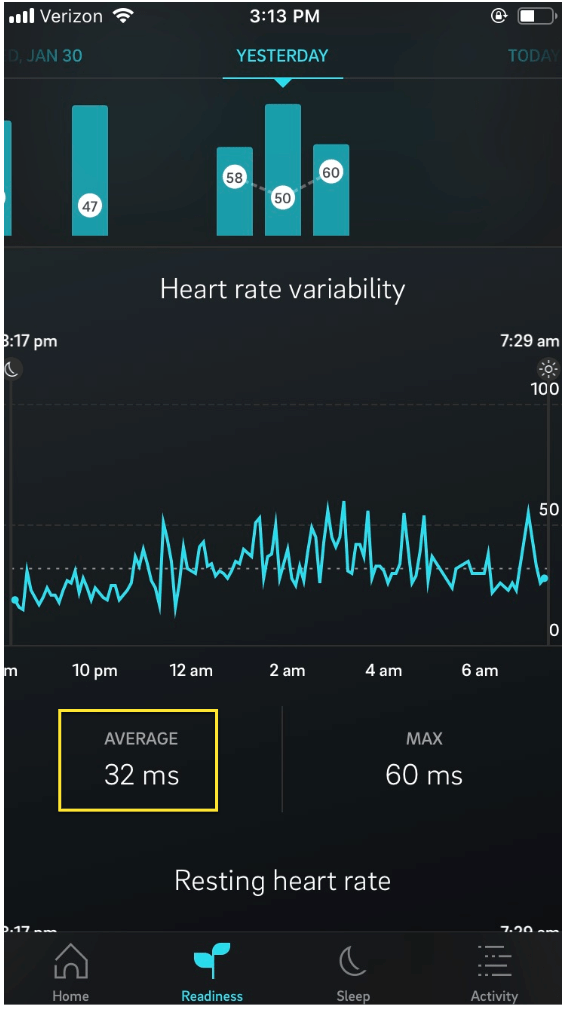
At the time of this post, Oura currently does not report the HRV CV in their app. Thus we are calculating this in Heads Up Health using the average HRV value during the sleep cycle as reported by the Oura app:
Figure 1: Oura HRV Average
Using these average HRV values we then calculate the Oura Coefficient of Variation (HRV CV) as follows:
Calculate the natural logarithm (ln) value of the nightly HRV average as reported by the Oura app (figure 1)
Calculate the mean and standard deviation from the prior 7-day HRV values
Divide the standard deviation by the mean
Show as a percentage
Note: Some experts in the field have suggested a more accurate method would be to look at the Oura HRV readings from the deep (slow wave) sleep states or by looking at the HRV readings just prior to waking. We are open to changing our approach here based on feedback from users. Feel free to send us your comments.
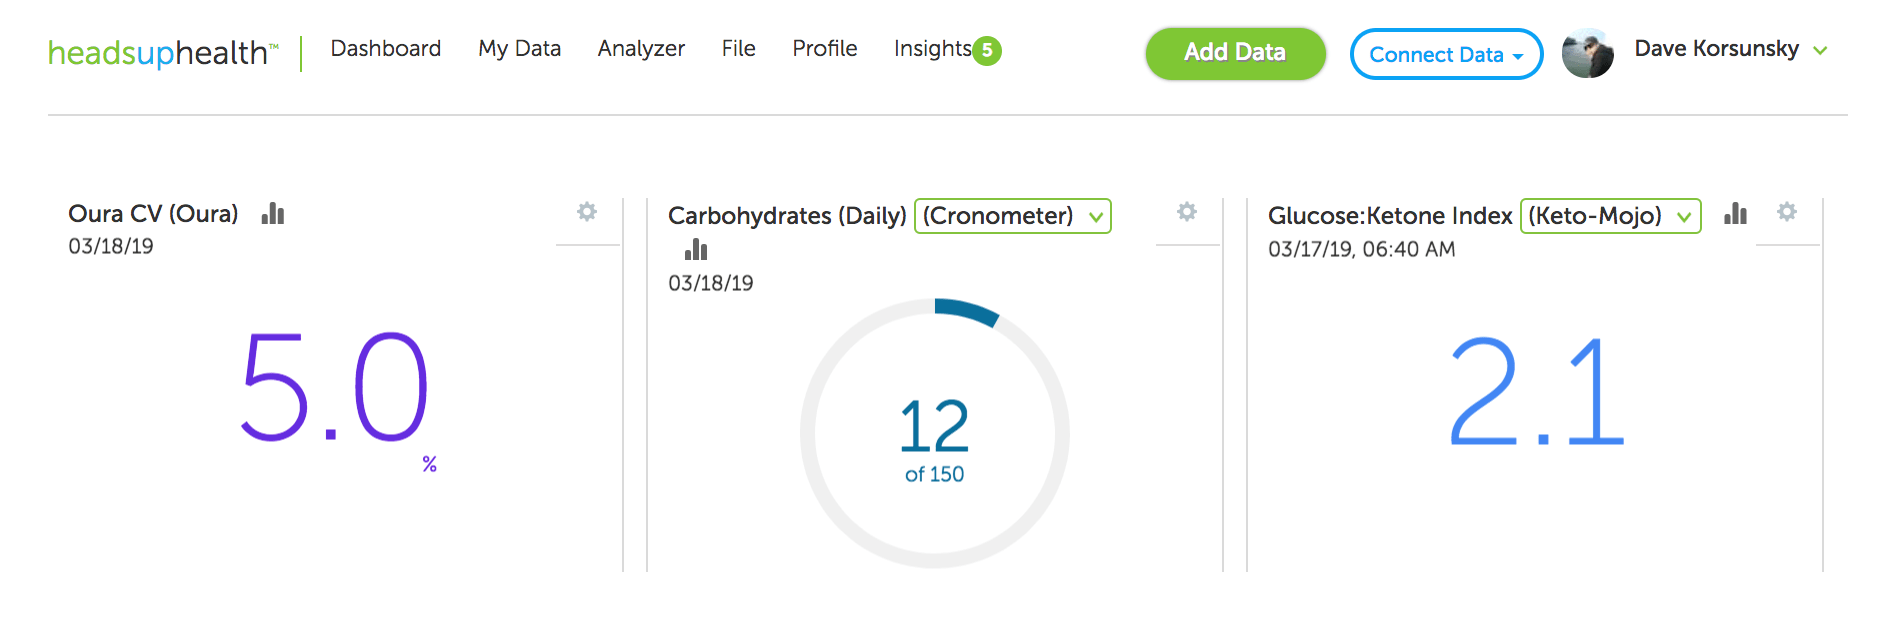
Tracking Oura CV in Heads Up Health
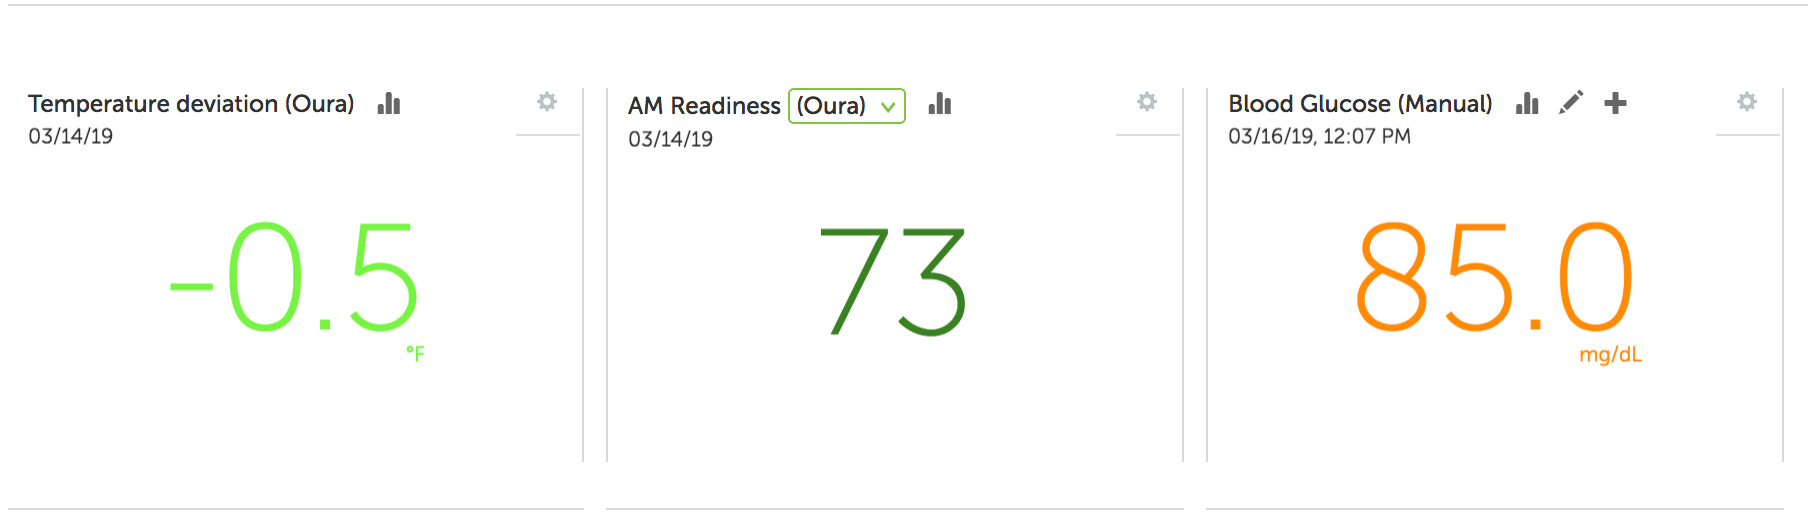
You can now add the Oura CV metric onto your Heads Up Health dashboard:
Figure 2: Add the Oura HRV CV to your dashboard
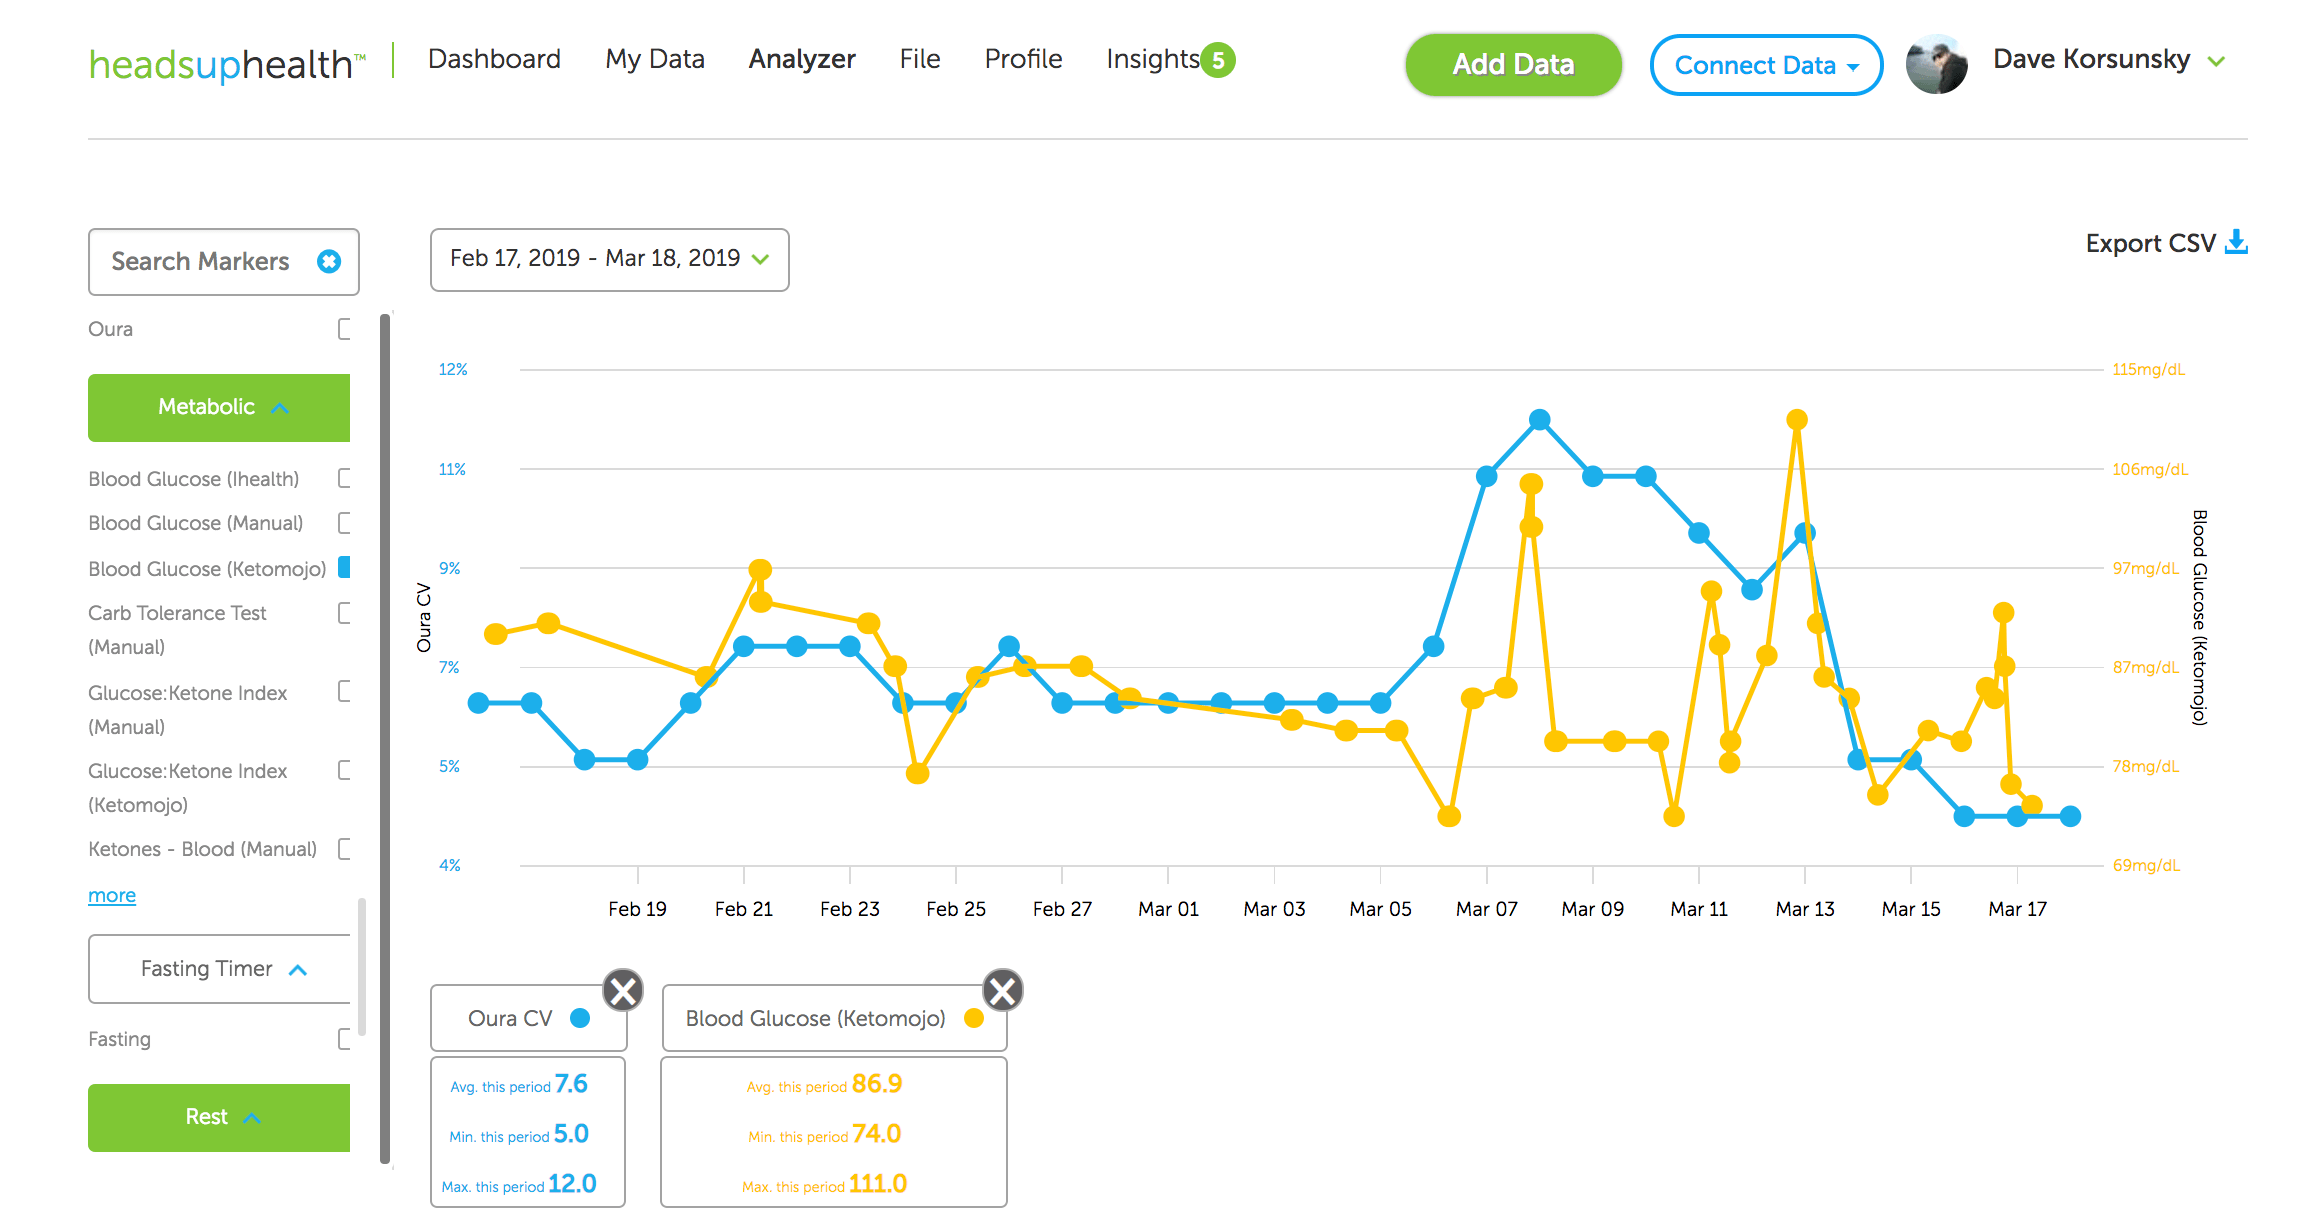
You can also graph this marker on the Analyzer next to any other health metric to explore your own correlations:
Figure 3: Compare your Oura HRV CV metrics on the Analyzer
Moving the needle
Why would these numbers increase or decrease? The CV reflects the fluctuation in your day-to-day HRV over the last 7 days. High or low HRV readings relative to your baseline will, therefore, contribute to a higher CV whereas more consistent or stable HRV readings will contribute to a lower CV.
Why is lower better?
When the rolling average is stable or increasing, a lower CV reflects less disturbance in autonomic homeostasis. This may mean that you are experiencing less stress or simply coping with it better.
The CV must always be interpreted in context. For example, a night of high-quality sleep may increase HRV well-above baseline, contributing to a higher CV. In a situation like this, the elevated CV is obviously not reflecting higher stress. In addition, stress is important as it stimulates adaptation. Therefore, an increased CV is a normal response to a greater or novel stimulus. However, repeated exposure and adaptation to the stimulus should provoke smaller HRV fluctuations over time and therefore a lower CV. Here, the reduced CV reflects an improved ability to tolerate and recover from the stressor and thus a capacity for greater stress.
Important lifestyle factors which can affect HRV CV
Any factor that alters HRV from baseline contributes to an increased CV. Common factors that affect HRV include:
Travel/jet lag
Physical stress such as high-intensity exercise
Mental and emotional stress
Over-training / injury
Sleep quality and quantity
Illness
Drastic changes to daily routines
Pain
Blood sugar fluctuations
Hydration
Heads Up Health can help you holistically track these other lifestyle factors to help identify areas that need attention.
Summary
The HRV CV is another powerful biomarker we can use to further understand how we are managing the stressors in our daily lives. Heads Up Health now supports this metric. This is an initial implementation and we will further refine this feature as required.
Ready to start tracking your Oura HRV CV? Start your free trial using the button below!
[maxbutton id=”9″ ]
References and Recommended Reading on the CV
Flatt, A.A. Improving HRV Data Interpretation with the Coefficient of Variation https://elitehrv.com/improving-hrv-data-interpretation-coefficient-variation
Buchheit, M., Mendez-Villanueva, A., Quod, M. J., Poulos, N., & Bourdon, P. (2010). Determinants of the variability of heart rate measures during a competitive period in young soccer players. European journal of applied physiology, 109(5), 869-878.
Flatt, A. A., & Howells, D. (2019). Effects of varying training load on heart rate variability and running performance among an olympic rugby sevens team. Journal of science and medicine in sport, 22(2), 222-226.
Flatt, A. A., Esco, M. R., Allen, J. R., Robinson, J. B., Earley, R. L., Fedewa, M. V., … & Wingo, J. E. (2018). Heart rate variability and training load among national collegiate athletic association division 1 college football players throughout spring camp. The Journal of Strength & Conditioning Research, 32(11), 3127-3134.
Flatt, A. A., & Esco, M. R. (2016). Evaluating individual training adaptation with smartphone-derived heart rate variability in a collegiate female soccer team. The Journal of Strength & Conditioning Research, 30(2), 378-385.
Flatt, A. A., Hornikel, B., & Esco, M. R. (2017). Heart rate variability and psychometric responses to overload and tapering in collegiate sprint-swimmers. Journal of science and medicine in sport, 20(6), 606-610.
Flatt, A. A., Esco, M. R., Nakamura, F. Y., & Plews, D. J. (2017). Interpreting daily heart rate variability changes in collegiate female soccer players. J. Sports Med. Phys. Fitness, 57, 907-915.
Flatt, A. A., & Esco, M. R. (2015). Smartphone-derived heart-rate variability and training load in a women’s soccer team. International journal of sports physiology and performance, 10(8), 994-1000.
Nakamura, F. Y., Pereira, L. A., Rabelo, F. N., Flatt, A. A., Esco, M. R., Bertollo, M., & Loturco, I. (2016). Monitoring weekly heart rate variability in futsal players during the preseason: the importance of maintaining high vagal activity. Journal of sports sciences, 34(24), 2262-2268.
Plews, D. J., Laursen, P. B., Kilding, A. E., & Buchheit, M. (2012). Heart rate variability in elite triathletes, is variation in variability the key to effective training? A case comparison. European journal of applied physiology, 112(11), 3729-3741.
Tonello, L., Reichert, F. F., Oliveira-Silva, I., Del Rosso, S., Leicht, A. S., & Boullosa, D. A. (2016). Correlates of heart rate measures with incidental physical activity and cardiorespiratory fitness in overweight female workers. Frontiers in physiology, 6, 405.
We’ve added support for tracking core temperature deviation from the Oura ring. You can now add this metric to your dashboard and see how it correlates with other biomarkers: