EHR vs. Health Data Analytics Platforms: How Cerbo, Elation, and Healthie EHR Users Can Transform Care with Heads Up Health

EHR vs. Health Data Analytics Platforms: How Cerbo, Elation, and Healthie EHR Users Can Transform Care with Heads Up Health

Introduction: The Gap in Modern Healthcare Data

Most practices rely on Electronic Health Record (EHR) systems such as Cerbo EHR, Elation EHR, or Healthie EHR to manage patient information, comply with regulations, and document care. But EHRs alone cannot deliver the real-time analytics, continuous monitoring, and patient engagement that today’s proactive, personalized care demands.

That’s where Heads Up comes in. Not to replace your EHR, but to amplify it!


What Is an EHR?

An EHR is the official digital version of a patient’s medical record, used for clinical, legal, and billing purposes.

Core Functions of EHR Systems

  • Store patient demographics, visit history, and medical conditions.

  • Document diagnoses, medications, allergies, and immunizations.

  • Manage orders for labs, prescriptions, and imaging.

  • Support insurance billing and coding.

  • Ensure HIPAA and ONC compliance.

Focus: Documentation, compliance, and continuity of care across providers.

Examples in Practice:

  • Cerbo EHR: Flexible for functional medicine, with supplement protocol tracking.

  • Elation EHR: Streamlined charting for primary care and concierge medicine.

  • Healthie EHR: Telehealth friendly for nutrition, wellness, and lifestyle programs.


What Is a Health Data Analytics Platform?

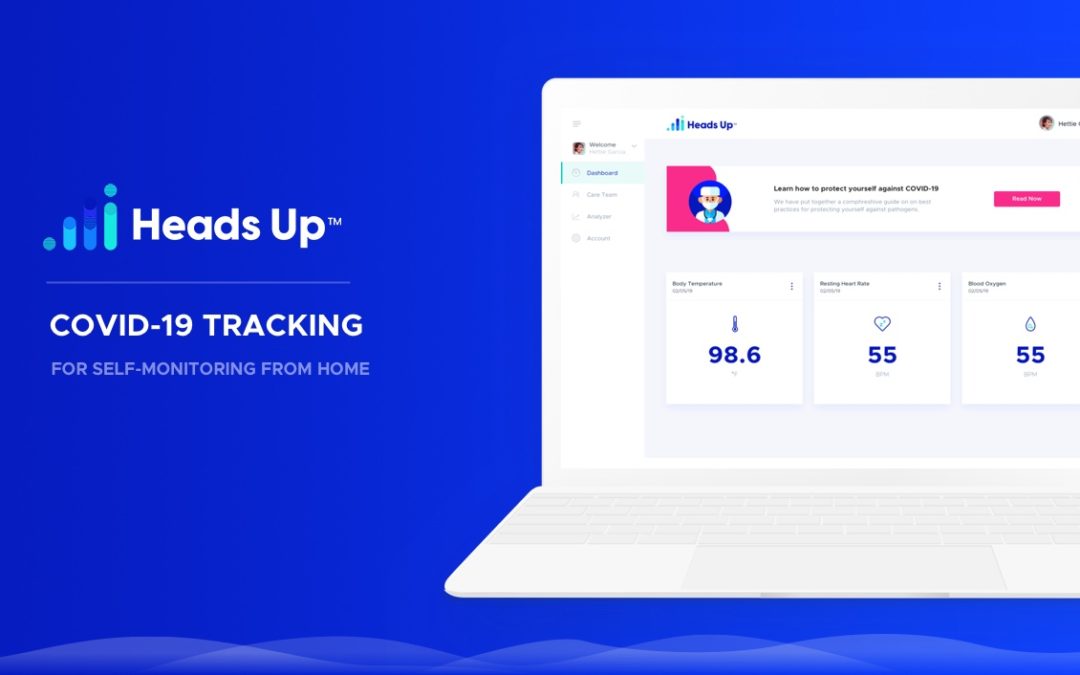
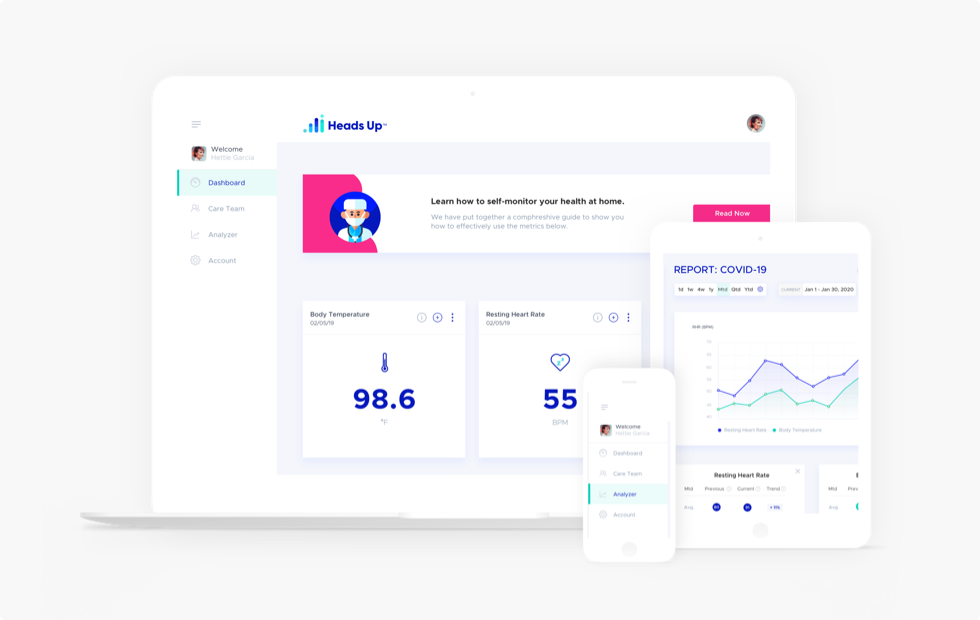
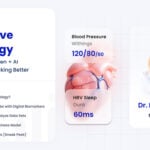
A health data analytics platform like Heads Up Health is designed to aggregate, analyze, and visualize health metrics from multiple sources including EHRs, wearables, labs, and at-home devices, to provide actionable insights for personalized, proactive care.

Core Functions of Health Data Analytics

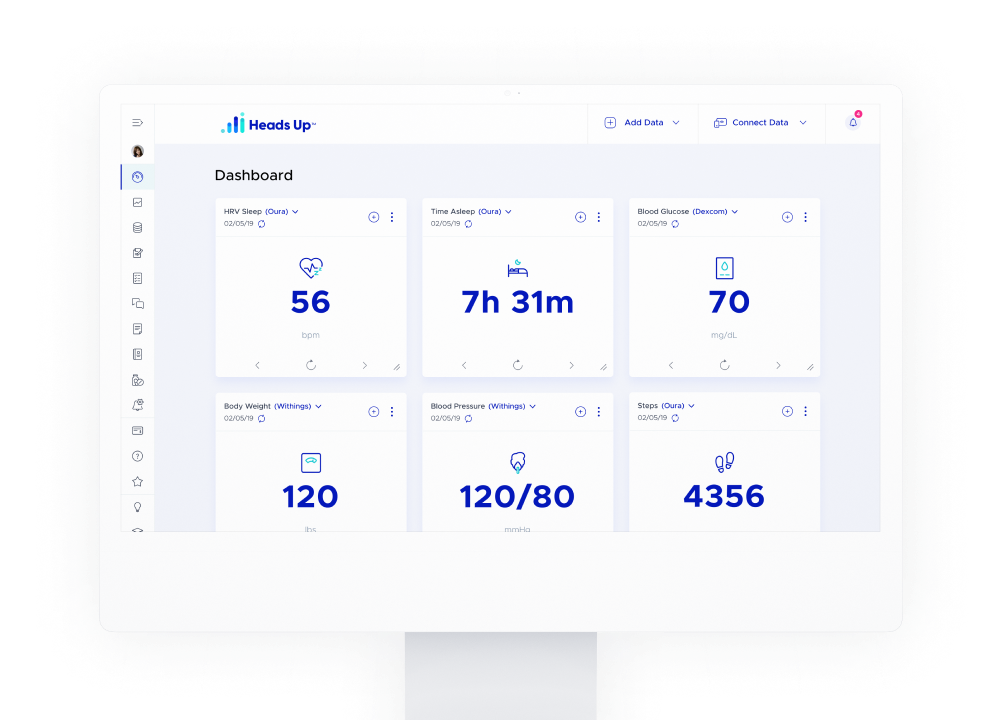
  • Pull data from multiple sources like: EHRs, wearables, connected devices, labs, and apps.

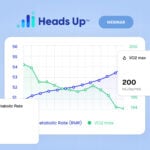
  • Provide real-time dashboards and longitudinal trend analysis like glucose, HRV, sleep, weight, and lab trends

  • Generate alerts for early intervention.

  • Track outcomes and validate program success.

  • Patient-facing dashboards for engagement and self-management

Focus: Turning raw data into actionable insights for personalization, prevention, and optimization of care.

Example use cases: Remote patient monitoring, longevity tracking, validating treatment effectiveness, integrating lifestyle and clinical metrics.


EHR vs Health Data Analytics: A Side-by-Side Comparison

Feature / Function EHR (Cerbo, Elation, Healthie) Heads Up Health
Purpose Manage official medical record Transform data into actionable clinical insights
Data Sources Provider-entered + ordered labs EHR, wearables, devices, labs, manual entry
Time Horizon Episodic (visit-based) Continuous (real-time & longitudinal)
Analytics Basic reports Advanced analytics & trend tracking
Patient Engagement Basic portal Interactive dashboards & goal tracking
Compliance High HIPAA-compliant

Why EHRs Alone Are Not Enough

While Cerbo EHR, Elation EHR, and Healthie EHR are excellent for record-keeping, they are not designed for:

  • Continuous data collection between visits

  • Real-time risk alerts

  • Wearable + lifestyle metric integration

  • Cohort-based outcomes validation

Without these, clinics risk reactive care models and missed opportunities for early intervention.


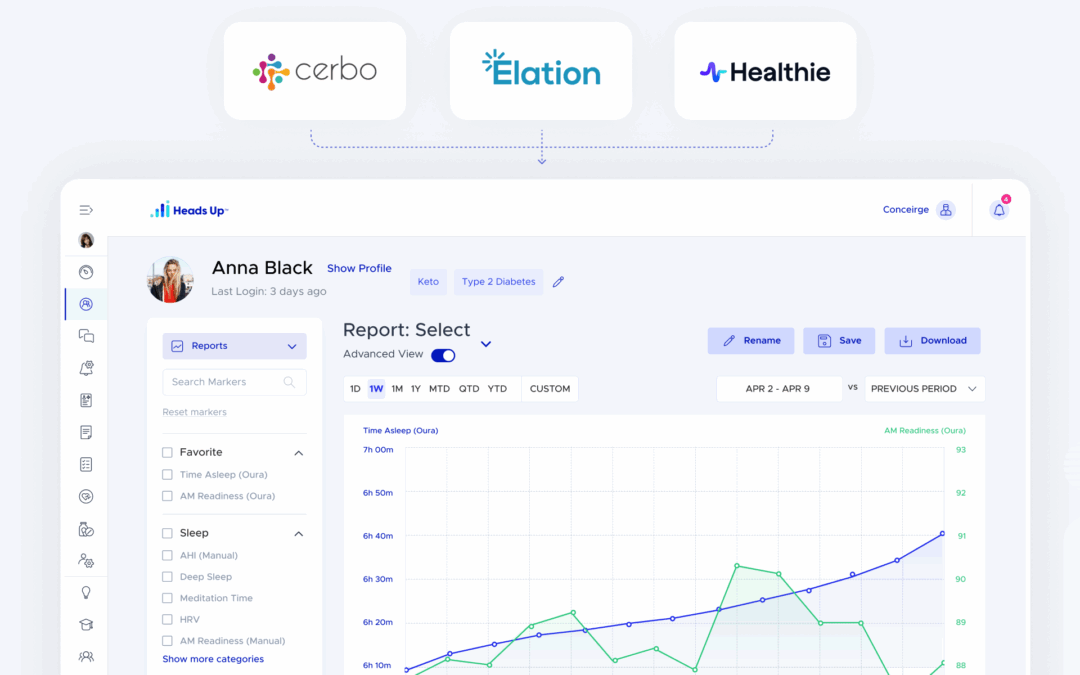
How Heads Up Health Integrates with Cerbo, Elation, and Healthie EHR

With Cerbo EHR

Automatically syncs labs, protocols, and visit notes while overlaying continuous wearable and lifestyle data.

With Elation EHR

Enhances concierge medicine workflows by providing real-time dashboards for patient engagement and risk monitoring.

With Healthie EHR

Pairs telehealth nutrition consults with continuous glucose monitoring and HRV data for instant dietary and lifestyle adjustments.


What’s the Delta?

  • An EHR is like the patient’s official “medical filing cabinet” secure, standardized, and used for day-to-day recordkeeping and compliance.

  • Heads Up Health is like the “mission control center” pulling in data from everywhere, making it visual and actionable, and enabling proactive, data-driven decision-making that most EHRs aren’t built to do.


Real-World Outcomes from Combining EHR + Analytics

Clinics using both an EHR and Health Data Analytics report:

  • 30%+ boost in treatment adherence

  • Fewer emergency visits from early detection alerts

  • Higher patient satisfaction through personalized care

  • Expanded service lines like remote patient monitoring and longevity programs


The Future: EHR + Analytics as the Gold Standard

The future of modern medicine is hybrid:

  • EHRs = the compliant, legal system of record.

  • Analytics platforms = the intelligence layer for precision care.

Combining Cerbo EHR, Elation EHR, or Healthie EHR with Heads Up Health allows clinics to move beyond reactive record-keeping to outcome-driven, proactive healthcare.


Conclusion & Call to Action

If your practice is ready to integrate real-time analytics, continuous monitoring, and outcome validation with your existing EHR, Heads Up Health is your next step.

Schedule a demo today to see how our platform works alongside Cerbo, Elation, and Healthie EHR to elevate patient care and profitability.


Heads Up provides a system to integrate all of the different data that you need to really deliver practice-based outcomes…

Dr. Brad Jacobs

BlueWave Medicine

Tracking Patient Health Data Has Never Been Easier!

Leverage The Power Of Heads Up in your Health Practice

Get started with by scheduling custom demo with one of our specialists to see the difference Heads Up can make in your practice. Schedule your demo and discovery call here.

Optimize Health & Longevity

Synchronize your clients’ medical records, labs, wearables, apps, and more into Heads Up for better outcomes. 
Sign Up now for a free starter account!

Health Monitoring During COVID-19

Health Monitoring During COVID-19

In times of uncertainty, confusion, and fear, especially when it comes to our health, we believe a little data can go a long way towards prevention, early detection, and peace of mind.

In that spirit, we have created a special covid-19 version of our health dashboard so you can monitor your vital signs and remotely monitor the vital signs of your loved ones – especially those at high risk. 

Let’s take a look at the metrics on your personal covid-19 dashboard.

Body Temperature

The first tile on your dashboard tracks body temperature. The most common symptom of infection with the coronavirus is a fever – about 90 percent of patients suffer from it, according to the World Health Organization.

You can test body temperature with any standard glass or digital thermometer. You likely already have a thermometer sitting at home in your medicine cabinet.

For a typical adult, the normal temperature can be anywhere from 97F to 99F. That’s why testing regularly can help establish your personal baseline, which will make it easier to detect if/when your numbers start to go out of range. 

Anything above 100F degrees is considered a fever. You may feel terrible, but on the whole, a fever isn’t bad for you. It’s a sign your body is doing what it should when germs invade. It’s fighting them off.

However, if your temperature is 103F or higher or if you’ve had a fever for more than 3 days, please contact your doctor. You should also contact your doctor if you have a fever with symptoms such as severe throat swelling, vomiting, headache, chest pain, shortness of breath, stiff neck or rash.

Resting Heart Rate

As our body temperature rises, our resting heart rate also rises above normal. Therefore, we can use resting heart rate as another early indicator of potential illness.

Much like your body temperature, a normal resting heart rate can vary from person to person. A normal resting heart rate for adults ranges from 60 to 100 beats per minute. That’s why it’s good to establish a baseline over several days so you know your personal resting heart rate value.

To measure your heart rate, simply check your pulse. Place your index and third fingers on your neck to the side of your windpipe. To check your pulse at your wrist, place two fingers between the bone and the tendon over your radial artery — which is located on the thumb side of your wrist.

When you feel your pulse, count the number of beats that you feel in 15 seconds. Simply multiply this number by four to calculate your heart beats per minute, then record the value on your covid dashboard.

Try to be consistent with your testing. Test at the same time each day and in the same seated position to ensure consistency.

If you think you may be getting sick and your resting heart rate starts to increase significantly above your baseline, it might be worth a call to your healthcare professional.

Blood Oxygen

If you are at home and dealing with a coronavirus infection, particularly if symptoms become severe (especially shortness of breath), testing blood oxygen can help you and your doctor determine if you should seek medication attention.

Individuals with pre-existing respiratory or cardiovascular conditions (asthma, collapsed lung, anemia, heart disease, pulmonary embolism, congenital heart defects, COPD) are at higher risk during the coronavirus outbreak. 

If you are one of these individuals you may wish to closely monitor your blood oxygen levels with a pulse oximeter. If you don’t yet own a device they can be easily purchased online for approximately $30.

This device measures oxygen saturation and refers to the extent to which hemoglobin is saturated with oxygen. Hemoglobin is an element in your blood that binds with oxygen to carry it through the bloodstream to the organs, tissues, and cells of your body.

Normal oxygen saturation is usually between 96% and 98%. If your levels are below 90% or you are feeling shortness of breath, please contact your healthcare professional.

Blood pressure

The last item on your dashboard is for blood pressure. Much like blood oxygen, tracking this metric is mainly intended for those with pre-existing cardiovascular conditions who may be at higher risk if exposed to coronavirus.

If you think you are at higher risk, regularly tracking blood pressure levels can be very helpful in the event you need to seek medical attention. Your doctor can review your readings which can help with appropriate treatment. 

Like all the metrics discussed here, consistency is very important. Take readings after you’ve been sitting still for a few minutes and try to test at the same time each day and in the same seated position. 

Summary

Some simple self-monitoring can be very helpful for you and your loved ones. The data can provide some peace of mind for those not exhibiting symptoms. For those who are experiencing symptoms, depending on the severity, the data can mean the difference between knowing when to seek medical attention and when to stay home.

Our covid-19 dashboard is free during the current global pandemic as our way of contributing to the greater good. 

If you have questions about the dashboard, feel free to shoot us an email at support@headsuphealth.com

If you have questions about your health, please contact your doctor.

Disclaimer: The content in this post is not intended to be a substitute for professional medical advice, diagnosis, or treatment. Always seek the advice of your physician or other qualified health provider with any questions you may have regarding a medical condition. Never disregard professional medical advice or delay in seeking it because of something you have read in this post.