Breath, Metabolism & Measurable Outcomes

Breath, Metabolism & Measurable Outcomes

Breath, Metabolism & Measurable Outcomes: How Respiratory and Metabolic Testing Are Changing Clinical Programs

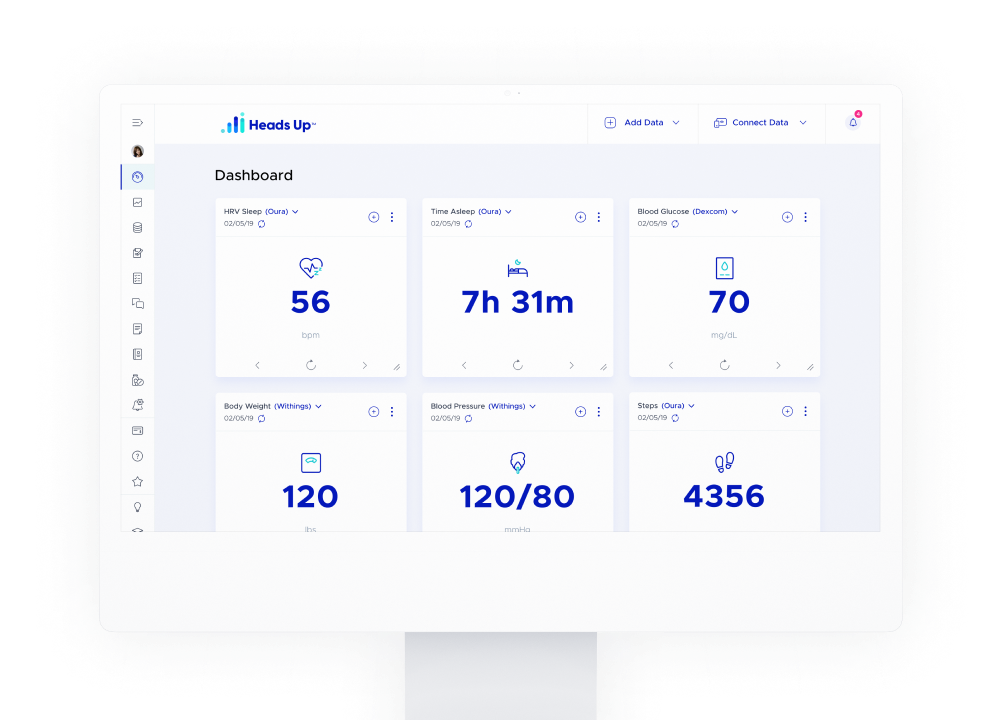
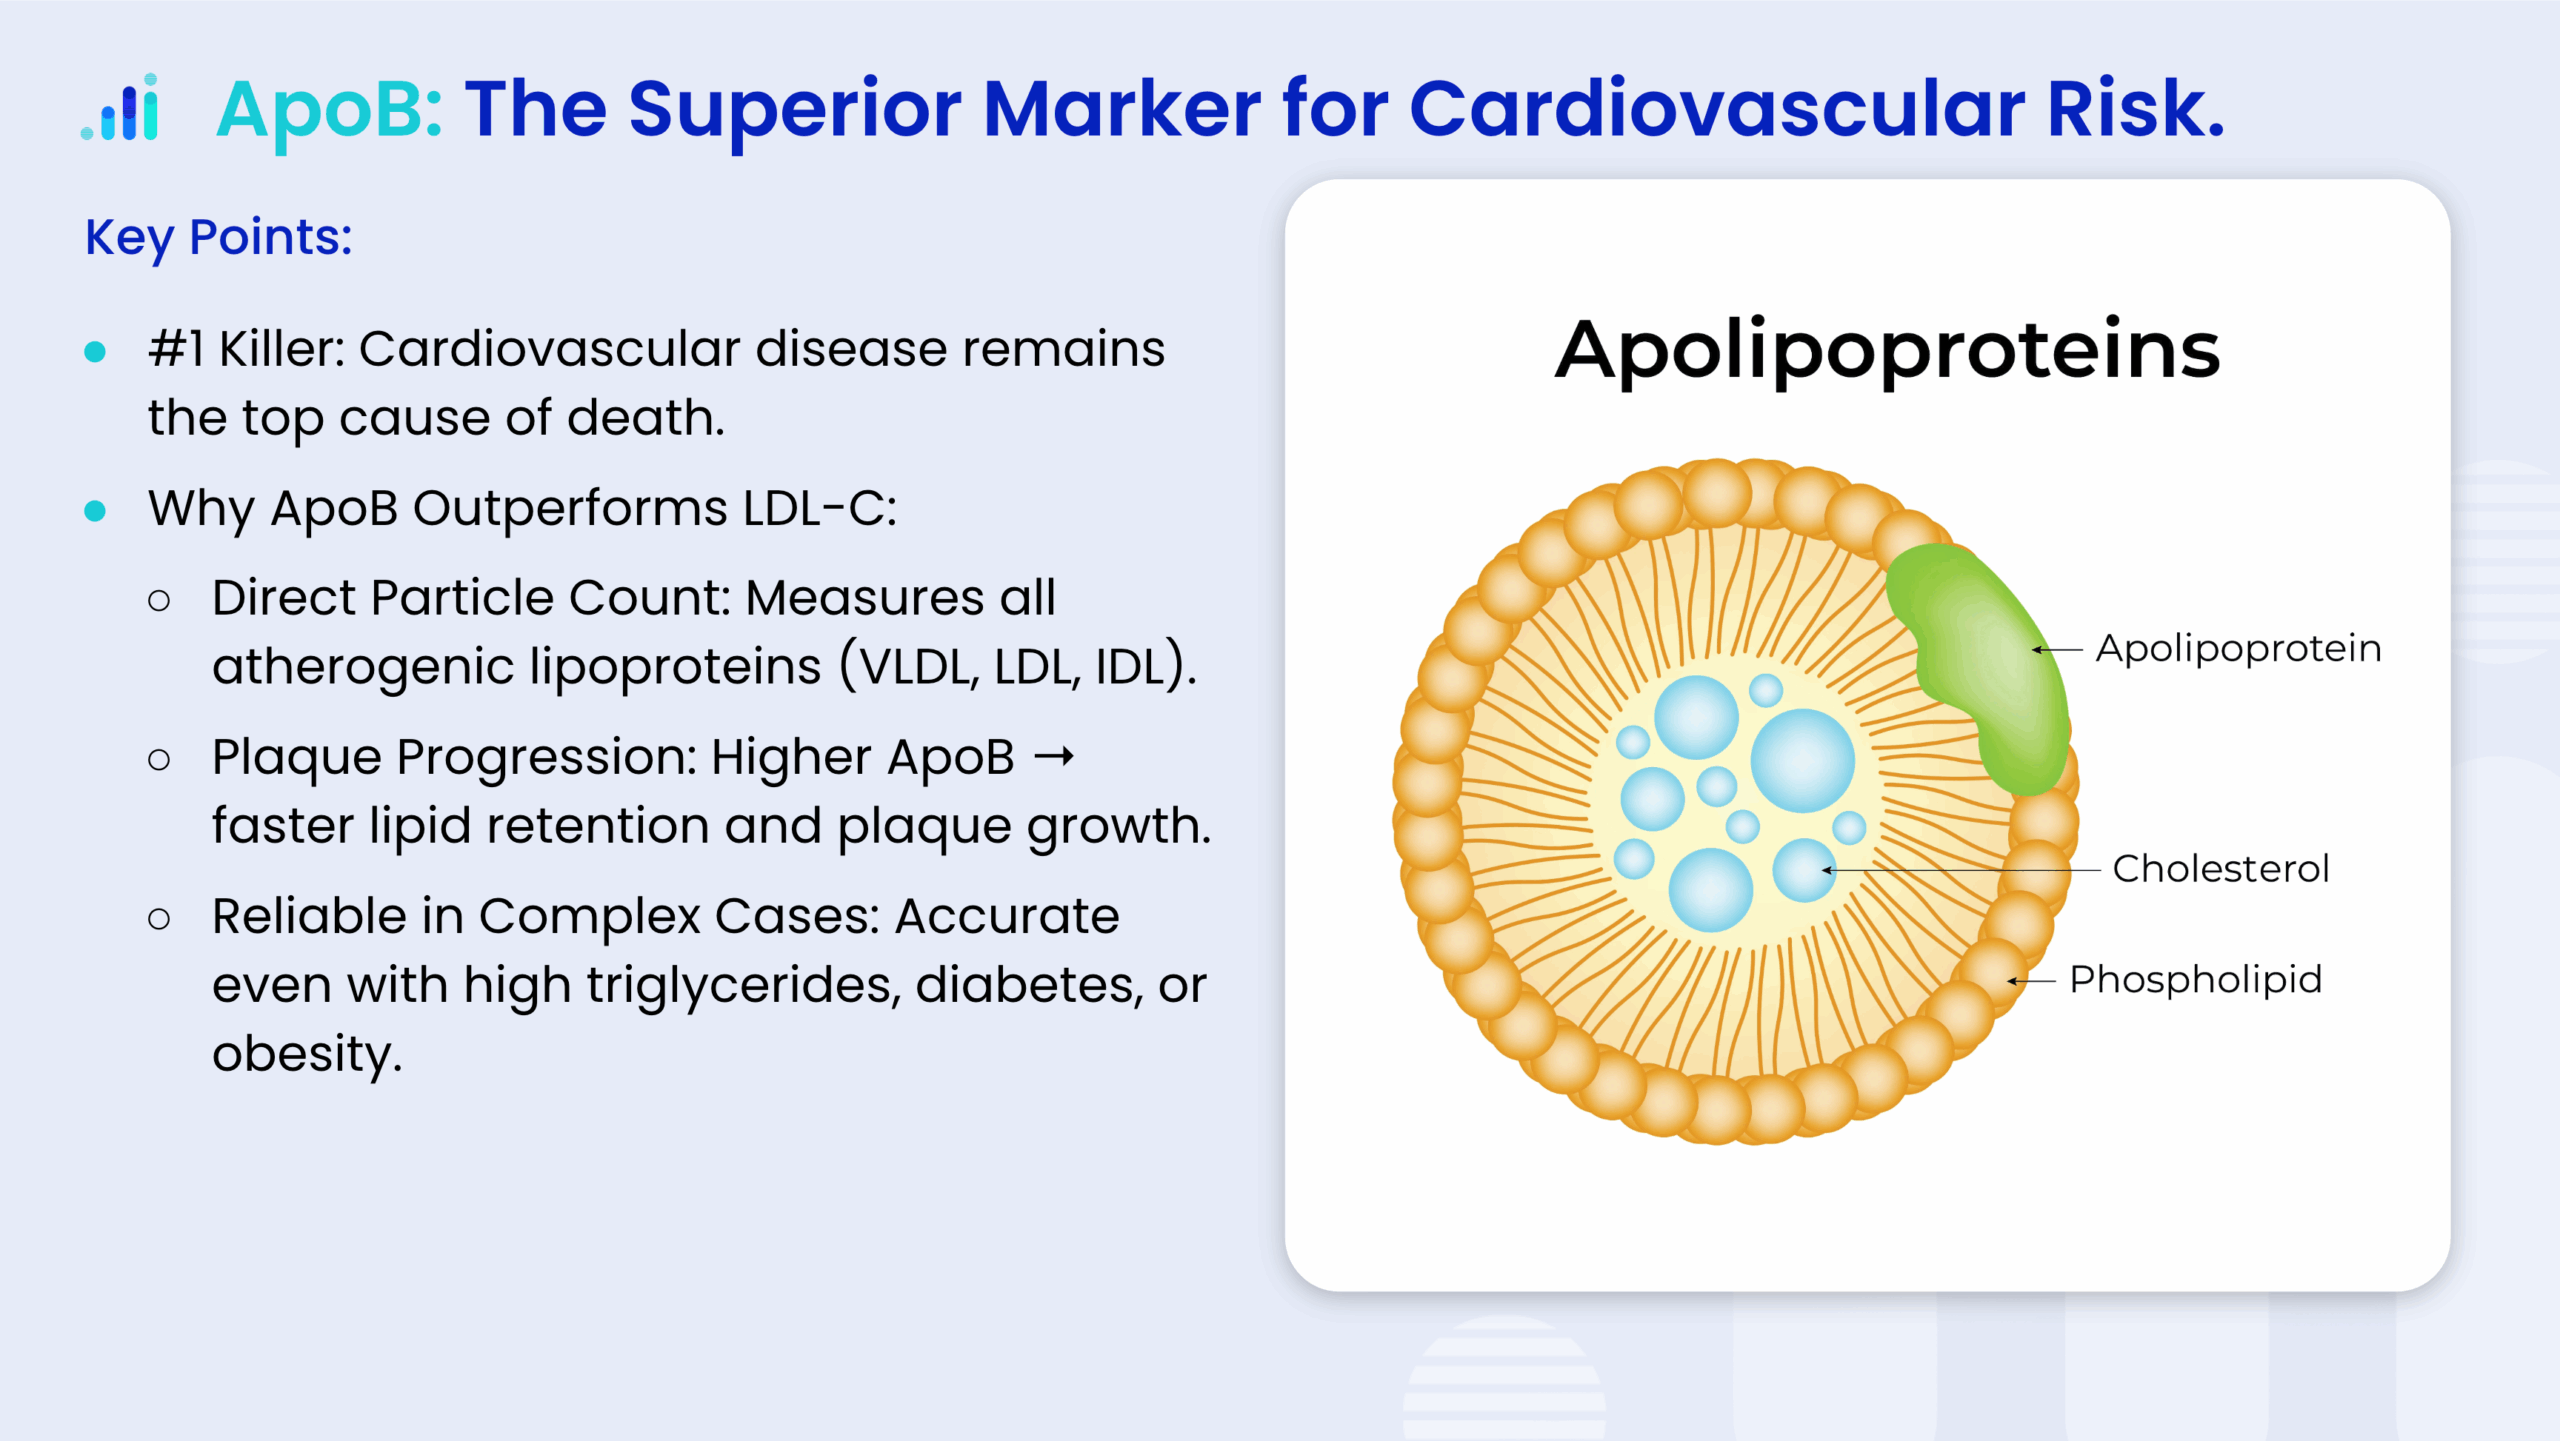
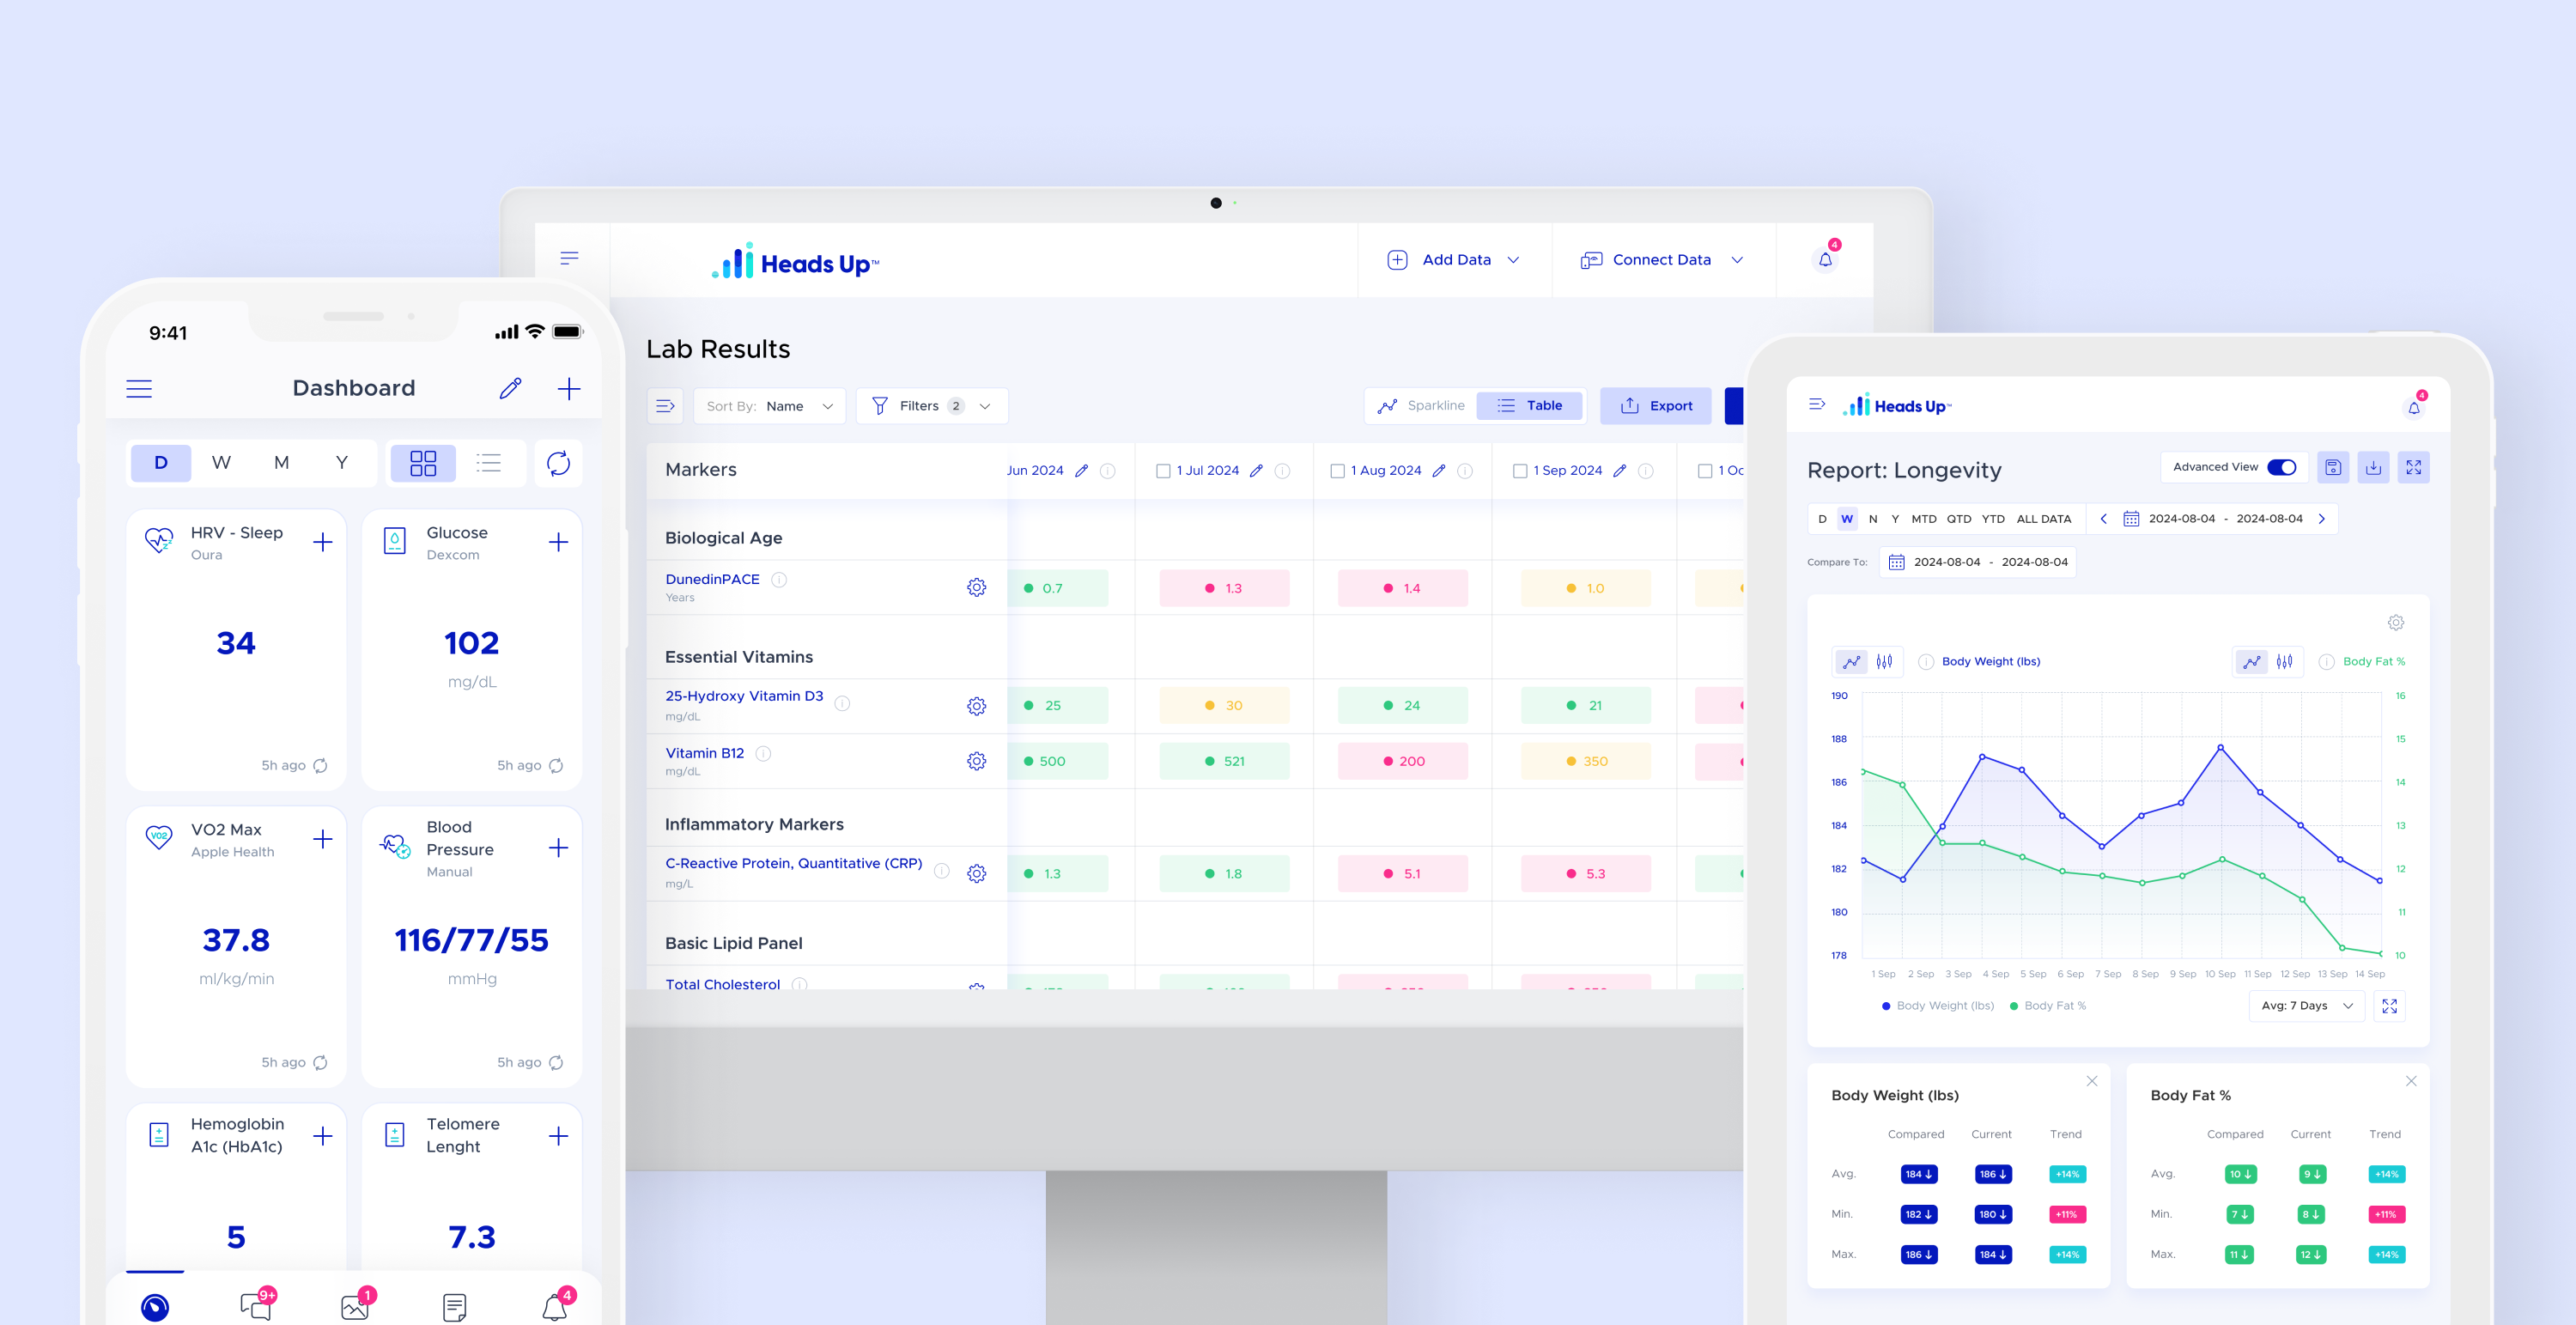
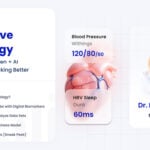
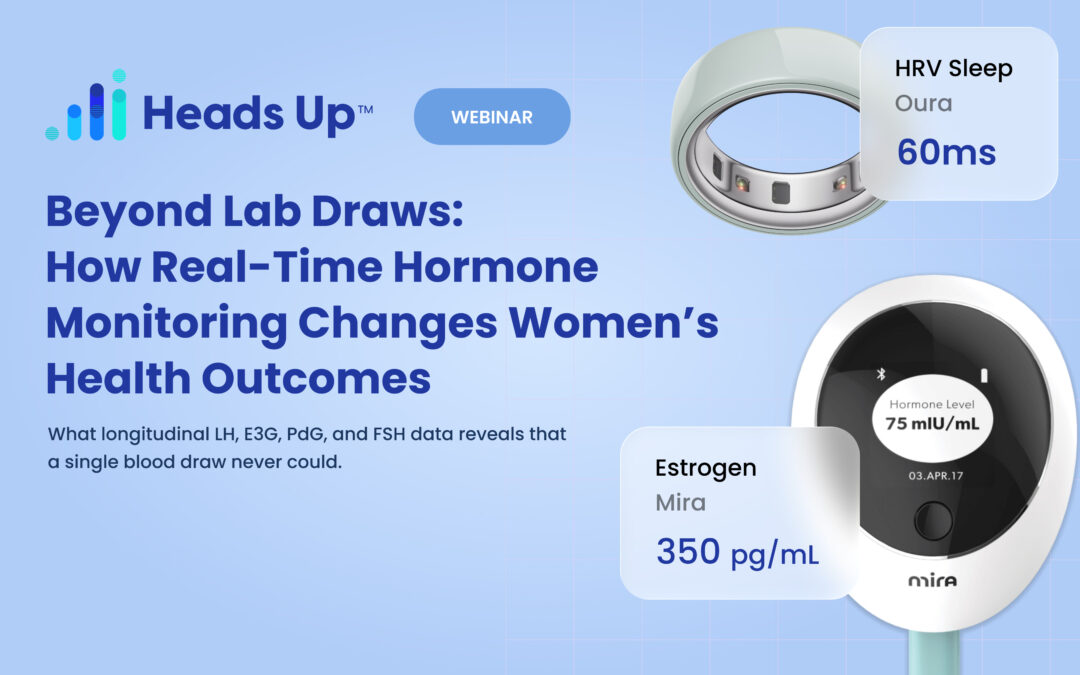
Discover how Heads Up and O2Max are bringing clinical-grade metabolic and respiratory data (VO₂ max, RMR, spirometry, HRV, and CO₂ tolerance) into one longitudinal clinical view, giving clinicians the context they need to find the limitations that wearables and standard diagnostics can’t reveal.

In this 90-minute clinical session, Gilles Essiembre, founder of O2Max, walks through how breath, metabolism, and respiratory mechanics are quantified, the limitations clinicians can spot with a complete metabolic profile, and how simple retraining protocols produce measurable changes in fat oxidation, stroke volume, and exercise tolerance. Through real case studies (a Toronto Maple Leaf hockey player, an 85-year-old golf patient, six firefighters in New Brunswick, and a live walkthrough using panelist Leonard Pastrana’s own data) he shows what becomes visible when respiratory and metabolic data are read together, and how to act on what you see. Heads Up CEO Dave Korsunsky shares his own transformation, and panelist Leonard Pastrana, PharmD adds clinical longevity context throughout.

VO2MAX

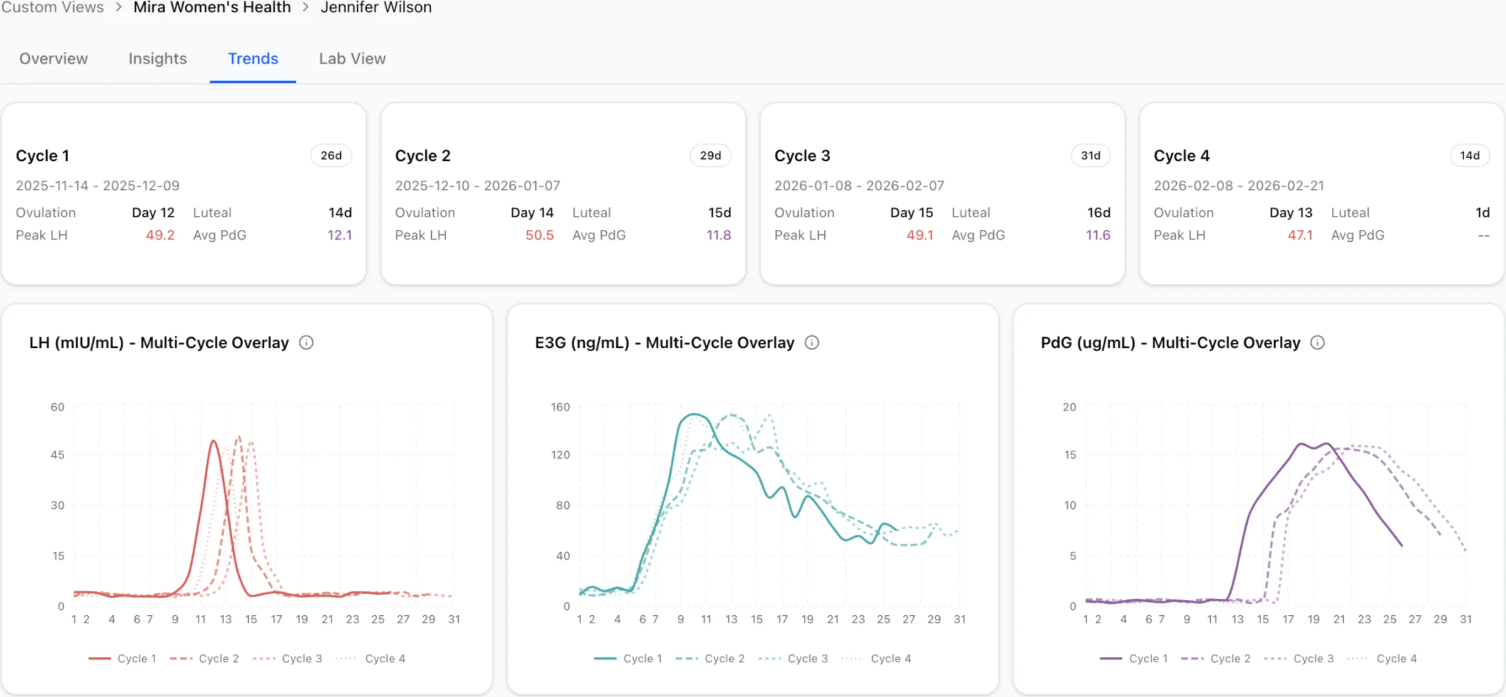
Overview, an O2Max metabolic report showing the 40+ biomarkers captured in a single session.
Gilles Square

Featured Speaker

Gilles Essiembre

Founder, O2Max

Gilles Essiembre, founder of O2Max, is a metabolic and respiratory health consultant who works with wellness and performance clinics around the world to reverse metabolic age, increase performance, and optimize breathing, metabolism, endurance, and overall health for clients ranging from professional athletes and longevity clients to those with asthma, COPD, and pulmonary conditions.

Using advanced testing, data analysis, HRV optimization and scientifically backed respiratory training methods, Gilles collaborates with leading clinics, coaches, pulmonologists, and health professionals to deliver personalized insights and programs that improve oxygen utilization, CO₂ tolerance, cellular health, and metabolic efficiency, helping clients achieve higher performance and a healthier life.

What you’ll learn

01

Why VO₂ max alone misses the bigger picture

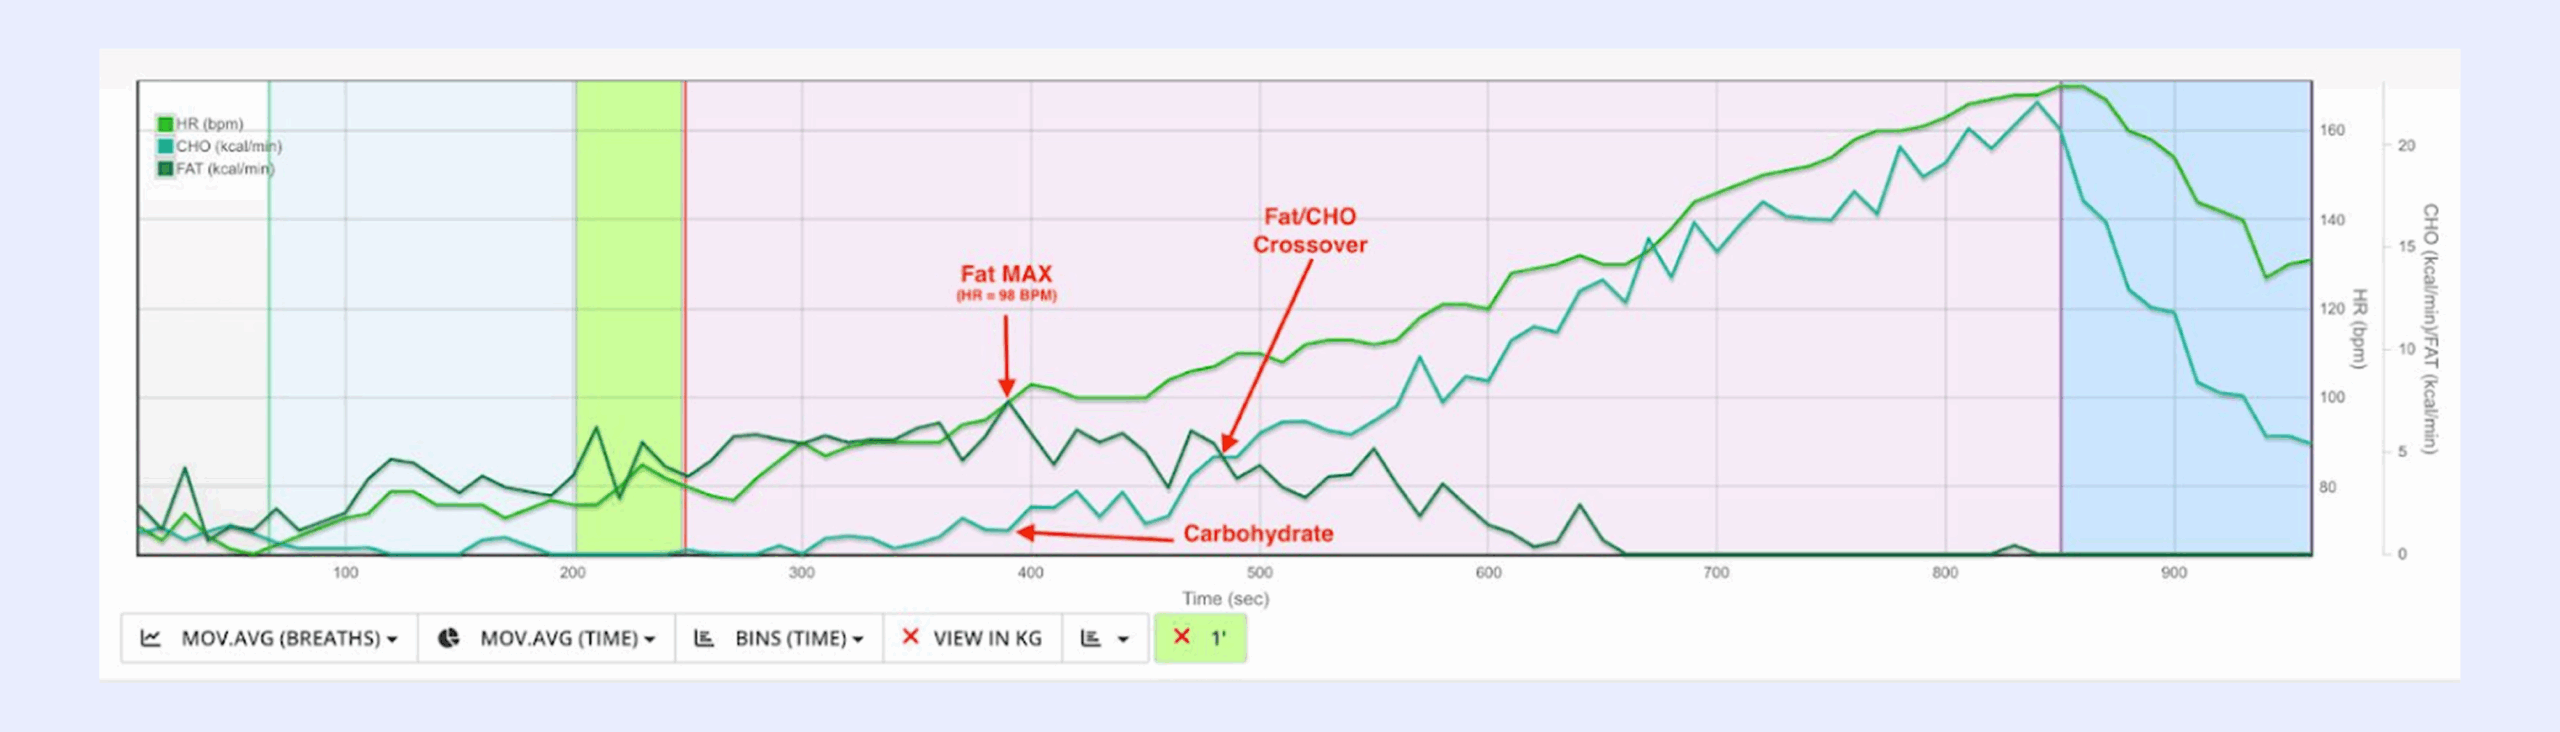
Standard VO₂ max gives clinicians one biomarker. A complete metabolic and respiratory profile reveals 40+, including breathing frequency, tidal volume, minute ventilation, fat versus carbohydrate substrate utilization, oxygen extraction, and ventilation efficiency at every heart rate.

02

How to spot chronic over-breathing in your clinic

The symptom cluster most clinicians never connect: brain fog, frequent yawning, cold hands and feet, anxiety, exercise intolerance. All can trace back to a respiratory limitation that an RMR or HRV reading picks up in ten minutes.

03

CO₂ tolerance and the BOLT score

An underappreciated longevity marker. How to test it, why it correlates to nervous system regulation, metabolic flexibility, and even mental health, and how patients improve it in weeks.

04

The breath retraining method, with a live case study

Gilles walks through a real-time case study using panelist Leonard Pastrana’s own data. By keeping everything else identical and slowing his breathing from 24 to 16 breaths per minute, Fat Max increased 40%, stroke volume gained 10%, and oxygen absorbed per breath jumped 66%, in a single session, with no other intervention.

05

The six pillars of respiratory muscle training

Capacity, exhalation power, inhalation power, diaphragm endurance, coordination, and mobility, plus the Isocapnic device training that builds respiratory capacity without requiring physical exercise.

Quick recap

Gilles Essiembre, founder of O2Max, presents on the limitations of single-biomarker thinking in clinical performance and longevity practice. Using real case studies from professional athletes, longevity clients, and his own live assessment of co-panelist Leonard Pastrana, PharmD, Gilles demonstrates how clinical-grade metabolic and respiratory data reveals 40+ biomarkers that wearables and snapshot diagnostics cannot. Heads Up CEO Dave Korsunsky shares his own transformation through breath retraining, and Leonard Pastrana (co-founder of nuBioAge, faculty at Human Longevity Institute) provides clinical longevity context throughout. The session covers VO₂ max, RMR, spirometry, HRV, CO₂ tolerance, the metronome retraining method, and the six pillars of respiratory muscle training.

Summary

The “invisible ceiling” most clinicians miss

Dave opens the session by sharing his own experience: years of sleep optimization, diet, peptide therapy, and HRV tracking, and yet a respiratory limitation he couldn’t see. Gilles explains that chronic over-breathing limits oxygen delivery at the cellular level, blunts fat oxidation, and silently caps the results of every other clinical intervention. The clue isn’t in any single wearable metric; it shows up across RMR, HRV, and CO₂ tolerance readings interpreted together. As Dave puts it, “I was in better shape than the data revealed. I just wasn’t actually breathing properly.”

What a complete metabolic profile actually measures

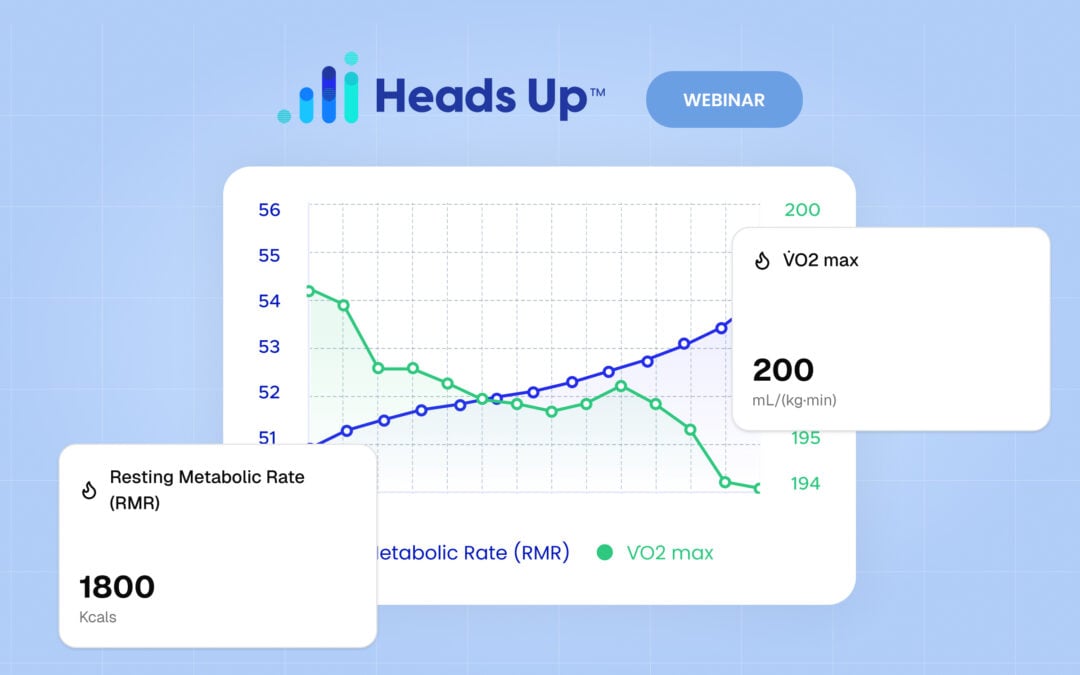
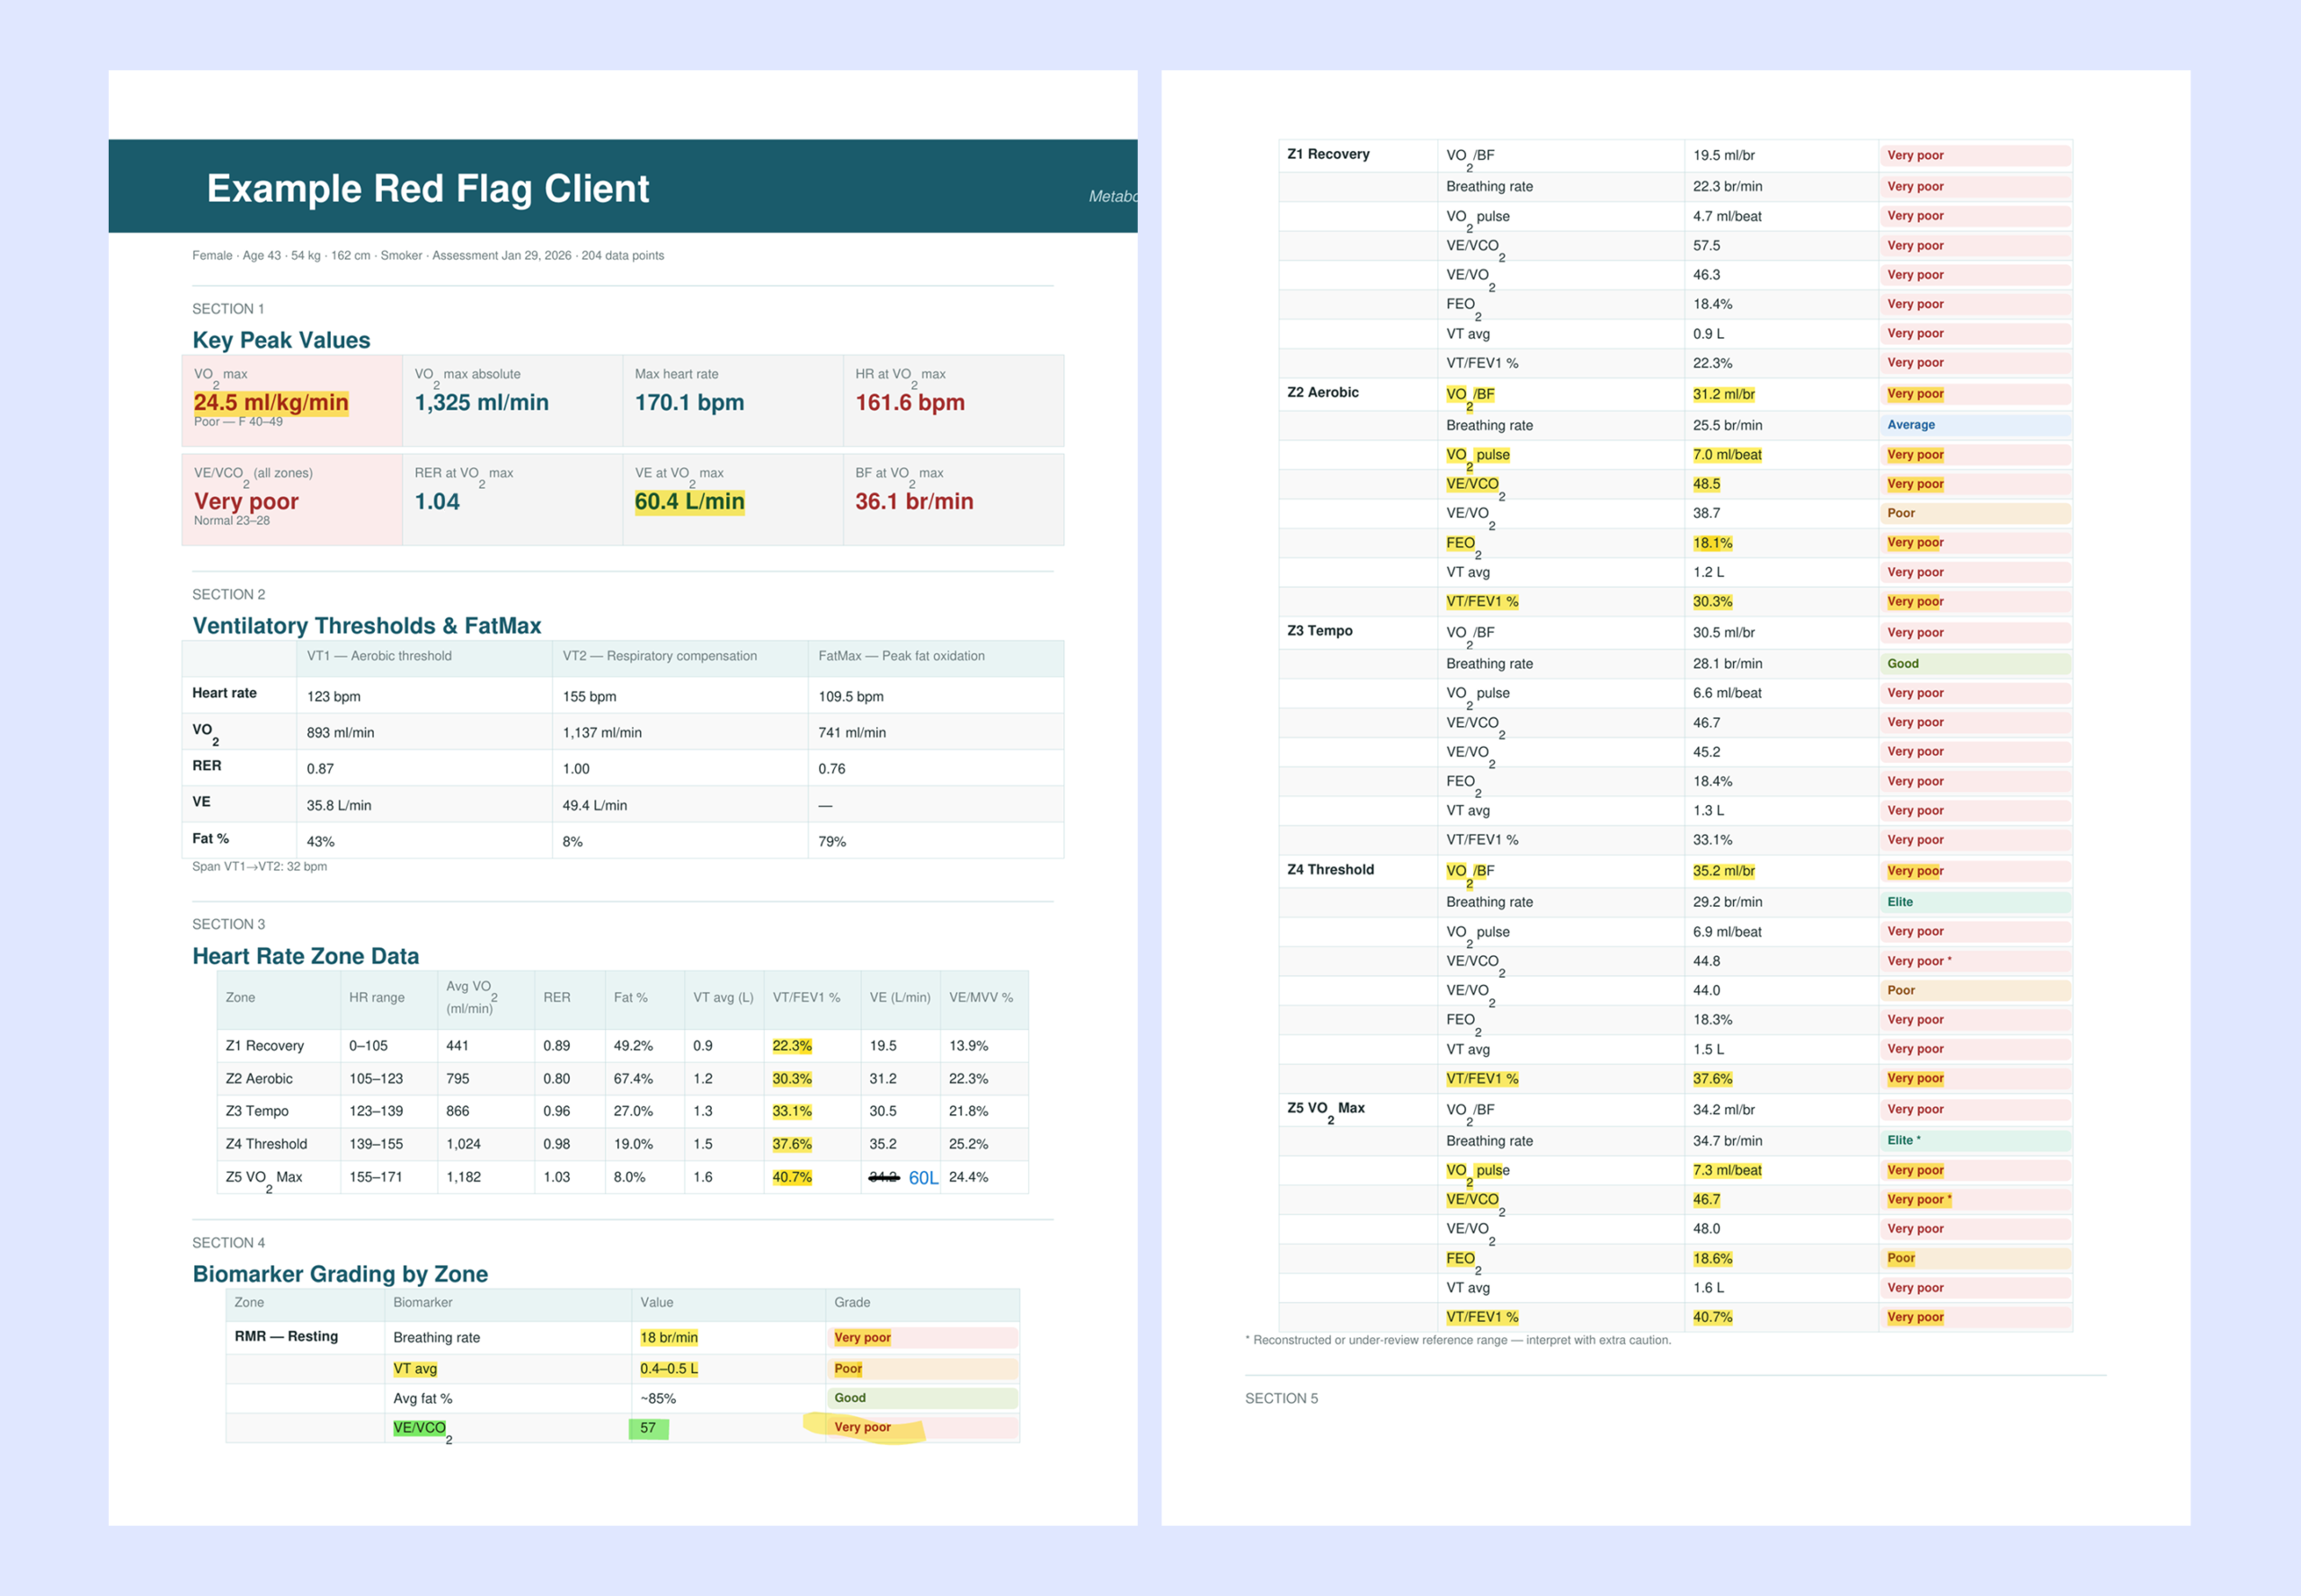
Gilles walks through what O2Max captures in a single clinical session: resting metabolic rate, VO₂ max, spirometry (FVC, FEV1), heart rate variability, and CO₂ tolerance (the BOLT score plus a walking variation). The system reads 40+ biomarkers across breathing frequency, tidal volume, minute ventilation, fat versus carbohydrate substrate utilization, oxygen extraction, ventilation efficiency, stroke volume, and lactate threshold, at every single heart rate during the test.

Case study: Dr. Leonard Pastrana’s breath manipulation

Live in the webinar, Gilles walks through a case study using his co-panelist’s own data. By keeping everything else identical and slowing Leonard’s breathing from 24 to 16 breaths per minute using a metronome, Fat Max increased by 40%, stroke volume gained 10%, oxygen absorbed per breath jumped 66%, and his Zone 2 ceiling moved from 4.4 to 6.7 miles per hour, a 50% gain in pace at the same metabolic effort. No conditioning. No supplements. No peptides. Just breath retraining.

Beyond the elite athlete: outcomes across the spectrum

The same principles apply across the population. Gilles shares results from a Toronto Maple Leaf hockey player (VO₂ max +16%, stroke volume to 36 ml/beat, treadmill endurance +13%), an 85-year-old golfer who went from struggling to finish 9 holes to comfortably enjoying 18 with energy left over, six firefighters in New Brunswick (33% lower breathing rate, 32% gain in CO₂ tolerance, 20% reduction in minute ventilation at 8.5 mph), a Taiwanese professional soccer team that averaged 16% VO₂ max gains in four weeks, and an Olympic swimmer whose anxiety attacks were visible in her breath pattern before she said a word about them.

The metronome method and Isocapnic training

For clinicians wondering what “retraining” actually looks like in practice, Gilles demonstrates the metronome patients use during runs to retrain breath frequency. Pair that with the Isocapnic respiratory trainer (a device that moves as much air as a 5-kilometer run while sitting down) and most patients see measurable shifts in 4 to 6 weeks. The breath rate prescription is calculated from a patient’s FEV1, minute ventilation, and current overventilation pattern, which means it’s personalized to lung size and respiratory capacity, not guessed.

The bigger picture: breath as the foundation of healthspan

Throughout the session, Dave returns to a central theme: for all the talk of fancy diagnostics, peptides, and wearables, the simplest variable in clinical performance and longevity is also the most overlooked. Yogic traditions have understood pranayama as the source of life for millennia; what’s new is the ability to quantify it. As Leonard adds, this is also where personalization in longevity medicine finally has the data to back it up. Once you can see the limitation, you can address it precisely, and the protocol stops being one-size-fits-all.

“The number one regulator of healthspan, it still comes down to breathing. At the end of the day, the simplest thing in the world.”

Dave Korsunsky

Founder & CEO, Heads Up Health

Next steps

Ready to see your data layer and AI layer working together? Book a 30-minute mapping session to design your pilot — including hormone data, wearables, labs, and the AI workflow on top.

Book a 30-minute mapping session

We’ll map your current data sources, identify the highest-leverage AI workflows for your practice, and outline a pilot — including success metrics.

Beyond Lab Draws: How Real-Time Hormone Monitoring is Changing Women’s Health Outcomes

Beyond Lab Draws: How Real-Time Hormone Monitoring is Changing Women’s Health Outcomes

Beyond Lab Draws: How Real-Time Hormone Monitoring is Changing Women’s Health Outcomes

Discover how Heads Up and Mira are bringing continuous hormone monitoring, longitudinal cycle data, wearables, and lab work into one unified view — giving clinicians the context they need to make sense of patterns that single time-point testing simply can’t reveal.

In this 90-minute clinical session, Rose MacKenzie walks through the limitations of single-point hormone testing in perimenopause, fertility care, and HRT management, then demonstrates how 30+ days of continuous data changes the conversation. Through three real patient cases, she shows what becomes visible when labs, hormone trends, and clinical context are read together — and how to act on what you see.

webinar image 1

Overview — current cycle with hormones overlaid across phases.
Speaker card

Featured Speaker

Rose MacKenzie, BSN, RN, CEN

Clinical Manager, Mira

Rose helps healthcare professionals and fertility-awareness educators successfully implement Mira in their practices. Her clinical background spans leadership, restorative women’s health, and emergency medicine, and she supports providers through webinars, case reports, and one-on-one consultations.

With 10+ years as a fertility-awareness instructor (Marquette Method, Sympto-Thermal), she has guided women across regular and irregular cycles, postpartum amenorrhea, chemo-induced menopause, and perimenopause.

What you’ll learn

01

Why single time-point hormone testing falls short

Continuous data prevents the misinterpretation and incomplete treatment decisions that snapshot labs can’t avoid — especially in perimenopause and menopause.

02

How to interpret longitudinal hormone patterns

Distinguish ovulatory variability, hormone deficiency or excess states, and cycle irregularities using LH, E3G, PdG, and FSH trends.

03

Improve diagnostic timing and treatment precision

More accurate mid-luteal testing, contextual interpretation of lab results, and adjusting interventions based on pattern recognition.

04

FSH as a longitudinal risk marker

How tracking FSH trends over time supports both symptom management and broader health risk assessment.

05

See the Mira × Heads Up integration live

How continuous at-home hormone data flows directly into your clinical workflow alongside labs and wearables.

Quick recap

Rose MacKenzie, Clinical Manager at Mira, presents on the limitations of fragmented, single-point hormone testing and the clinical impact of continuous, longitudinal hormone data. Rose walks through real patient cases — including a perimenopausal patient with shifting serum values, a PCOS patient with non-ovulatory LH surges, and an HRT initiation case — demonstrating how context-rich data changes diagnostic accuracy, treatment timing, and patient outcomes. Alex Smith from the Heads Up product team then demos how Mira data flows into Heads Up alongside labs, CGM, and wearable data in a single longitudinal view.

Summary

Why single-point hormone testing falls short

Rose opens by acknowledging the historical challenge clinicians face with hormone evaluation: relying on patient history, single snapshot serum labs, or fragmented patient self-tracking. She explains the shift from “1D or 2D” hormone snapshots to continuous, daily hormone data — measured at home through a simple urine test that captures E2, LH, FSH, and the metabolite of progesterone (PdG) over an entire cycle. The data flows automatically from the Mira device to the patient’s app, and from there into the Heads Up dashboard, where it sits alongside lab work, wearables, and clinical notes.

What a normal cycle actually looks like

Rose walks through the visual pattern of a healthy cycle — rising estrogen toward ovulation, the coordinated LH/FSH surge signaling brain-to-ovary communication, and the progesterone rise confirming the corpus luteum has formed. Without continuous data, clinicians are often making assumptions about what’s happening between lab draws — and those assumptions can lead to treatment decisions based on incomplete information.

53ee7274 6709 4cb2 a515 d87fcd6d414d

Insights — prioritized findings and data-driven summaries across systems.

Case 1: The perimenopausal patient with “normal” labs

Rose presents a 45-year-old patient with irregular cycles whose serum values varied dramatically depending on which day she happened to visit the lab. Within a single month, the same patient showed both low estrogen with high FSH and three weeks of high estrogen with low FSH — meaning a single random draw could yield completely different clinical interpretations. With continuous Mira data providing the context, those serum values suddenly become useful clinical information rather than confusing outliers.

Case 2: The PCOS patient and non-ovulatory LH surges

A patient with PCOS shows an attempt to ovulate that failed (estrogen rise + LH surge with no progesterone follow-through), followed by a successful ovulatory event later in the cycle. Without continuous data, a clinician would only see the second event and miss critical information about ovulation timing. For a fertility patient, knowing when ovulation actually occurred — versus when it appeared to occur — changes everything about timing intercourse, interpreting pregnancy tests, and understanding why a cycle “didn’t work.”

Case 3: HRT initiation and reading treatment response

Rose demonstrates how to interpret hormone data when a patient begins HRT — and importantly, how to recognize when a patient is “stacking” their own endogenous estrogen on top of HRT. Different forms of HRT (patch, gel, oral progesterone) create distinct patterns in the data, and reading those patterns correctly helps clinicians titrate dosing and identify when symptoms may be related to dosing timing rather than the medication itself.

The bigger picture: context matters

Throughout the session, Rose returns to a central theme: a single lab result is only as useful as the context surrounding it. Continuous hormone data provides that context, transforming what was previously a guess into a clinical conversation grounded in pattern recognition. When combined with labs, wearables, and symptom tracking — all visible in one place through Heads Up — clinicians have what they need to move from reactive symptom management to proactive, individualized care.

912ad15f 245c 445e 9393 7e24ea557f59

Trends — multi-cycle overlays of LH, E3G, and PdG side by side.

“If you have no Mira data, no longitudinal hormone data, then really, we are guessing more than we should be.

Rose MacKenzie

Clinical Manager · Mira

Webinar resources

PDF

Slides — Beyond Lab Draws

Designed for: functional and integrative medicine clinicians, longevity and concierge practices, reproductive endocrinologists, and women’s health programs working with longitudinal patient data.

Next steps

Ready to see your data layer and AI layer working together? Book a 30-minute mapping session to design your pilot — including hormone data, wearables, labs, and the AI workflow on top.

Book a 30-minute mapping session

We’ll map your current data sources, identify the highest-leverage AI workflows for your practice, and outline a pilot — including success metrics.

Integrative Cardiology

Integrative Cardiology

Medical Expert & Educator

Dr. Regina Druz MD, MBA, FACC, IFMCP

Integrative cardiologist and founder of Holistic Heart Centers, a leader in precision cardiology programs that unite genomics, functional medicine, and digital health.

Dr. Regina Druz, MD, MBA, MS, FACC is an integrative cardiologist, physician executive, and digital health entrepreneur. She is the CEO and founder of Holistic Heart Centers, a precision medicine platform for heart health optimization and longevity. Dr. Druz created Fit in Your GENES®, a proprietary program that applies genomics and functional medicine to improve cardiovascular health and vascular aging.

A graduate of Weill Cornell Medical College, she also holds an Executive MBA and an MS in Health Policy from Cornell University. Board-certified in cardiology and certified in functional medicine, Dr. Druz previously served as National Director of Cardiology for a leading value-based care organization. She is a national and international speaker and podcaster, and enjoys traveling with her family.

Integrative Cardiology: The New Data-Driven + AI Approach To Unlocking Better Patient Outcomes

Discover how world-class integrative cardiologist, Dr. Regina Druz, utilizes longitudinal labs, continuous digital biomarkers, and AI to personalize treatment plans, enhance engagement, improve outcomes, and run a more profitable practice.

Learn how modern integrative cardiology works when labs, wearables, and AI function as one workflow. We will clarify when labs are important, which digital biomarkers to monitor, and how to combine both for precision care. 

What You Will Learn

  • What is Integrative Cardiology? 
  • Combining Traditional Labs with Digital Biomarkers 
  • Case Reviews: How To Analyze Data Sets
  • Practice Integration + Business Model 
  • Revolutionary New AI Tools [Sneak Peek]

Quick recap

The webinar featured Dr. Regina, a functional medicine certified physician, who presented on Holistic Heart Centers and their precision cardiology approach focused on heart health optimization and longevity. She discussed the integration of diagnostics, labs, and wearables through the Heads Up platform and introduced digital biomarkers as key data points for assessing patient health trajectories. The presentation covered the importance of prevention in cardiovascular health, the role of integrative cardiology, and the use of medical-grade genetic data in assessing cardiovascular risk, and concluding with a demonstration of digital biomarkers in clinical practice.

Summary

Heads Up Platform Integration Webinar

David welcomed Dr. Regina to the webinar, highlighting her expertise in integrative cardiology and her contributions to previous webinars. Dr. Regina discussed the integration of diagnostics, labs, and wearables through the Heads Up platform, which synthesizes fragmented data to provide actionable insights for practitioners and patients. The webinar will conclude with a summary Q&A session and the announcement of giveaway winners.

Precision Cardiology and Digital Biomarkers

Dr. Regina, a functional medicine certified physician, presented on Holistic Heart Centers, a precision cardiology practice focused on heart health optimization and longevity. She discussed the importance of prevention in cardiovascular health and introduced digital biomarkers, which are data points collected from wearables and other devices that can provide insights into a patient’s health trajectory. Dr. Regina explained the difference between disease management and health optimization in cardiology, emphasizing the need for a new toolkit to guide patient health in the latter. She also highlighted the role of integrative cardiology and shared real patient cases to demonstrate the potential of digital biomarkers in improving patient care.

Integrative Cardiology: Precision and Personalization

The discussion focused on integrative cardiology, a framework that combines precision medicine with personalized lifestyle and therapeutic interventions to address residual cardiovascular risk beyond conventional treatments. The MI3 (Metabolic, Inflammatory, Immune, and Infectious) framework was introduced as a comprehensive approach to assess patients’ health across multiple domains, including hereditary predispositions, hormonal balance, and stress patterns. The speaker emphasized the importance of structured programs and digital biomarkers in documenting patient progress, while highlighting the need for a science-enhanced, data-driven approach to integrative cardiology.

Genetic Data for Cardiovascular Risk

Regina explained the use of medical-grade genetic data, including monogenic and polygenic scores, to assess cardiovascular risk. She highlighted that while large-effect genetic variants for conditions like familial hypercholesterolemia are rare, smaller genetic variants are more common and can contribute significantly to risk. Regina emphasized the importance of transitioning from known cardiovascular risk factors to identifying new patterns and strategies through data-driven approaches, including digital biomarkers and AI-powered decision support. She also discussed the challenges of insurance reimbursement for these advanced diagnostic tools and suggested alternative, more affordable options through direct purchasing.

Genetic and Biomarker Insights for LP(a)

Dr. Regina discussed the genetic component of LP(a), noting that 90% is genetic. She addressed HRT in women with a positive family history of CBD, emphasizing risk management and the importance of addressing cardiometabolic factors. Dr. Regina also explained the role of Ripatha, a PCSK9 inhibitor, in reducing LDL cholesterol and its potential impact on LP(a). She highlighted two digital biomarkers, metabolic age and vascular age, which can help assess biological aging and cardiovascular risk beyond chronological age. These measurements can be influenced by interventions such as physical activity and nutrition.

Digital Biomarkers in Clinical Practice

Regina presented on integrating digital biomarkers into clinical practice, focusing on metabolic and vascular age assessments using wearable devices like Withings scales. She demonstrated how to analyze patient data to track improvements and identify areas needing attention, such as sleep quality and lifestyle factors. The discussion covered the limitations and potential of digital biomarkers, emphasizing the importance of synthesizing traditional and digital data for comprehensive patient care. David and Angela announced giveaway winners and encouraged participants to book demos to learn more about implementing these tools in their practices.

Webinar Resources

“We are a precision cardiology practice focused on heart health optimization and longevity and Heads Up has been quite instrumental in terms of building our workflows and giving us a line of sight to work with multiple patients” 

Dr. Regina Druz MD, MBA, FACC, IFMCP

Holistic Heart Centers

Next Steps

Ready to see your data layer and AI layer working together?

How To Get Your Clinical Health Data AI Ready

How To Get Your Clinical Health Data AI Ready

How To Get Your Clinical Health Data AI Ready

Educators

  1. David Korsunsky, Founder & CEO, Heads Up
  2. Tom Cronin – Product, Airia 
  3. Doctor Kenneth S. Sharlin, M.D. M.P.H. Sharlin Health & Neurology

Clinical AI Readiness: How Clinics Turn Disconnected Health Data into Actionable Intelligence

AI is here. The practices that adopt it early are gaining an exponential edge.

In this non-technical, introductory session, you will discover how integrative, concierge, and longevity clinics are beginning to harness the power of AI and LLMs by combining clinical-grade data with secure, compliant AI tools.

You’ll get an introductory look at the new Heads Up + Airia integration built specifically for innovative clinics like yours.

You will also hear directly from Dr. Sharlin on how he is using AI + data as a strategic differentiator.

“I’m still the one driving, AI shortens the path and checks my thinking.”

Dr. Sharlin

Sharlin Health & Neurology

Introduction: Why AI in Clinics—Now

In this masterclass, we shifted from narrowly focused medical topics to a practical, clinic-first look at bringing AI into daily care. The promise is simple: unify your EHR fields, lab PDFs, wearables, imaging, and assessments under one roof—then layer HIPAA-safe AI on top to surface insights, automate prep, and scale repeatable workflows.

Who it’s for: integrative & functional medicine, concierge practices, prevention/longevity clinics, multi-provider groups, and any team buried in data but hungry for outcomes and efficiency.

What You Will Learn

  • How to Get Your Clinical Data AI-ready
    Most clinical data is still trapped inside EHR systems, PDF files, medical filing cabinets, wearables, paper records and other clunky formats. The process to get this data AI ready takes time. We will show you how you can get started today.
  • How to Ask Clinical Questions in Natural Language Using AI
    Quickly query your patient data using natural language prompts and get instant, data-driven answers.
  • Build Smarter, Personalized Treatment Plans with AI
    Learn how AI can help synthesize thousands of data points to support more precise, effective, and individualized protocols for every patient.
  • Leverage Global Expertise with AI-Supported Protocol Design
    Cross-reference your patient cases with cutting-edge research, published protocols, and expert recommendations instantly.
  • Operate in a Secure, HIPAA-Compliant AI Environment
    Learn how Airia + Heads Up enables safe, encrypted AI workflows using patient data designed from the ground up for clinical use.
  • Real-World Case Study: How Dr. Sharlin is Implementing an AI Strategy
    Shares his clinic’s approach to weaving AI into daily operations and how it’s creating a powerful competitive advantage in the brain health & longevity space.

Five High-Impact Use Cases

1) Chart Prep in Minutes (40:48)

 Deliver a daily pre-visit brief at 8:00 AM with:

  • Med changes since last visit
  • Abnormal labs with reference ranges
  • Oura/CGM deltas vs. baseline
  • “Don’t-miss” flags (e.g., radiology notes)
  • Configured to each provider’s preferences and routed to staff when needed.

2) Lab PDF Intake → Structured Data (54:44)

Parse Quest/Labcorp/DUTCH/Genova PDFs into discrete fields; normalize units & ranges; map to your SOPs for downstream analysis and protocol drafting.Med changes since last visit.

3) Protocol Drafts from Your Playbook (56:19)

Apply your reference ranges, preferred meds/supplement lines, dosing rules, and clinical SOPs to auto-draft plans for clinician review (human-in-the-loop).

4) Patient-Friendly Med/Supp Schedules

Convert EHR-style lists into clean visuals (timing, with/without food, sequences), drastically improving adherence.

5) Wearable Watchers & Cohort Signals (1:14:20)

Agents monitor HRV, sleep stages, recovery, CGM variability against rolling baselines, notify on meaningful changes (not noise), and suggest next-best actions.

From Prompts to Agents (54:44)

  • Prompts help you explore (“Show me patients with rising ApoB velocity and poor sleep scores”).
  • Agents help you scale (“Run that analysis weekly, alert the care team, and attach a plan template”).
  • Guardrails keep it repeatable, auditable, and safe.

Getting Started: A Low-Friction Playbook (27:18; 02:09)

  1. Secure the lane: HIPAA setup, BAA, model/vendor policies, RBAC
  2. Pick ONE workflow: Most clinics start with Chart Prep or Lab PDF Intake
  3. Define “done”: Inputs, outputs, formatting, delivery schedule, owners
  4. Pilot for 30 days: 3–5 providers; measure time saved and error reduction
  5. Scale with agents: Add wearable watchers, protocol drafts, and patient-friendly outputs

Why This Matters for Outcomes and Operations

  • Better decisions: longitudinal context + wearable trends beat isolated snapshots
  • Less cognitive load: teams walk into visits with the signal pre-sorted
  • Higher adherence: visual med/supp schedules and short explainers > dense PDFs
  • Revenue & retention: data-driven programs, value-based narratives, and measurable progress reports patients can see

Webinar Resources

Watch the Replay & Next Steps

Ready to see your data layer and AI layer working together?

  • Watch the full webinar replay (and share with your team)
  • Start with one workflow: Chart Prep or Lab PDF Intake
  • Book a 30-minute mapping session to design your pilot and metrics for success

Book your strategy call here with our AI practice experts.

Longevity Metrics Q&A: Epigenetic Clocks, ApoB, Insulin Resistance & AI in Clinical Practice

Longevity Metrics Q&A: Epigenetic Clocks, ApoB, Insulin Resistance & AI in Clinical Practice

Overview

At Heads Up, we recently hosted a live webinar on the top longevity metrics every clinic should be tracking to uncover risks, personalize care, and improve outcomes. Our special guest was Leonard Pastrana, PharmD, co-founder of nuBioAge and a leading educator in longevity medicine who has trained over 5,000 practitioners worldwide.

The Q&A session was packed with insights on biomarkers, testing strategies, and the future of AI in healthcare.

Below is a recap of the most important takeaways.

Epigenetic Clocks: Promise and Limitations

Q: What is the latest on the use of epigenetic clocks as biomarkers?

Dr. Pastrana explained that epigenetic clocks are exciting tools that estimate biological age, but they’re still evolving. Data from TrueDiagnostic and other providers show accelerated aging between ages 40–60, matching what clinicians see in practice (brain fog, body composition changes, metabolic decline).

  • Best use: Motivational for patients (“What’s my biological age?”).

  • Limitation: Still not robust enough for clinical decision-making compared to validated metrics like VO₂ max, ApoB, and fasting insulin.

  • Notable metric: Dunedin Pace of Aging (rate of biological aging per year) is one of the most promising markers for clinical use.


The 40–60 Window: Why It’s Critical

Research confirms that between ages 40–60, aging accelerates. This is also when early insulin resistance can drive vascular damage leading to Alzheimer’s decades later.

Takeaway: This is the “golden window” for clinical intervention. By tracking insulin resistance, ApoB, body composition, and VO₂ max, providers can intervene before irreversible decline.


ApoB vs. ApoB:A1 Ratio

Q: Is the ApoB:A1 ratio more important than ApoB alone?

  • Dr. Pastrana: ApoB remains the gold standard for cardiovascular risk, since it counts atherogenic particles.

  • Ratios can provide nuance, but decisions should be anchored on ApoB levels for clinical accuracy.


Hydration and Protein Preservation

Q: How much water is needed to stop protein degradation?

  • No set number, but generally 2–3 liters/day depending on body weight.

  • What matters: Intracellular water. Low cell volume signals catabolism and accelerates protein breakdown.

  • Solutions: Amino acids, creatine, and osmolites to support intracellular hydration.


Visceral Adipose Tissue (VAT) and Body Fat

Q: Is there a formula for reducing VAT below 1 lb based on body fat percentage?

  • VAT is highly bio-individual. Some lean patients have high VAT, while some obese patients have less than expected.

  • DEXA scans remain the gold standard for assessing VAT.

  • Key: Don’t rely on total body fat % alone — measure directly.


The “Dream Biomarker”: Continuous Fasting Insulin

When asked what biomarker he wished existed, Dr. Pastrana’s answer was clear: A continuous fasting insulin monitor, similar to today’s CGMs.

Why? Because insulin tells us how hard the pancreas is working to maintain glucose balance, and continuous data could revolutionize metabolic care.


GLP-1s and Weight Regain

Q: When should testing be done to predict weight regain after GLP-1 therapy?

  • Always establish baseline metabolic parameters before starting treatment.

  • Key metrics: Resting Metabolic Rate (RMR) and Fat Oxidation (breath testing).

  • Weight regain is often linked to:

    • Reduced metabolism due to caloric restriction.

    • Lean mass loss during weight reduction.

  • Solution: Resistance training, protein intake, peptides, and hormone optimization to preserve or rebuild lean mass.


Tirzepatide vs. Semaglutide

Q: Are there significant differences between the two?

  • Clinical differences are minimal.

  • Semaglutide may show slightly better triglyceride/VLDL reduction in studies, but real-world outcomes are similar.

  • Key factors: Patient tolerance and cost.


Affordable Alternatives to DEXA

  • Tools like InBody and SECA devices provide useful trends for lean mass and VAT scores.

  • Not as precise as DEXA, but valuable for monitoring direction over time.

  • Tip: Educate patients not to panic over day-to-day fluctuations (water weight, menstrual cycle, etc.).


HbA1c vs. Fasting Insulin vs. HOMA-IR

  • HbA1c is foundational for diabetes screening but less sensitive in early dysfunction.

  • Fasting Insulin is simple, direct, and highly valuable for detecting early metabolic issues.

  • HOMA-IR combines glucose + insulin for a broader view of insulin resistance.

Recommendation: Use all three, but fasting insulin remains a practical and powerful tool.


Demonstrating True Healthspan Gains

Q: How can clinics prove interventions are reversing biological age?

  • Focus on validated clinical metrics:

    • VAT reduction

    • ApoB lowering

    • VO₂ max improvement

    • Muscle mass gain

  • Patient-centered approach: Tie metrics back to personal goals (confidence, energy, longevity with family).

  • Heads Up enables providers to show before/after dashboards to demonstrate real progress.


Wearables: Tracking Between Lab Visits

  • Body composition scales (weekly trend data).

  • Oura Ring for HRV, sleep quality, recovery.

  • CGM for glucose and metabolic flexibility.

Between labs and DEXAs, these provide daily feedback loops to patients and clinicians.


Custom Longevity Scores

Heads Up now supports custom algorithm development, allowing clinics to combine:

  • Traditional labs (HbA1c, lipids)

  • Advanced markers (epigenetic clocks, VO₂ max, organic acids)

  • Wearables (HRV, sleep, activity)

Result: Proprietary Longevity Scores that differentiate your practice and prove outcomes at scale.


The Future: AI + Longevity Medicine

With Heads Up’s new AI layer, clinicians will soon be able to:

  • Query patient data with natural language.

  • Identify velocity of change across 10+ years of labs.

  • Auto-generate treatment plans based on data trends.

  • Highlight mismatched interventions.

The vision: Secure, HIPAA-compliant AI that turns complex health data into actionable insights in seconds.


 Want to see the full clinical longevity training?  Click the image below.

1 91 (37)

Conclusion

Longevity medicine is evolving fast, and the tools to track it are here. From epigenetic clocks to fasting insulin, from VAT scans to custom longevity scores, clinics can now deliver measurable outcomes that extend both lifespan and healthspan.

At Heads Up, we’re helping practices implement these metrics into daily care, unify fragmented data, and prepare for the next generation of AI-powered longevity medicine.

Want to build longevity programs that track, optimize, and prove outcomes? Schedule a Demo with Heads Up.

Tracking Patient Health Data Has Never Been Easier!

Leverage The Power Of Heads Up in your Health Practice

Get started with by scheduling custom demo with one of our specialists to see the difference Heads Up can make in your practice. Schedule your demo and discovery call here.

Optimize Health & Longevity

Synchronize your clients’ medical records, labs, wearables, apps, and more into Heads Up for better outcomes. 
Sign Up now for a free starter account!

Longevity Metrics: The Definitive Guide for Clinicians and Health Professionals

Longevity Metrics: The Definitive Guide for Clinicians and Health Professionals

Longevity Metrics: The Definitive Guide for Clinicians and Health Professionals

Introduction: Why Longevity Metrics Are the Future of Medicine

In the last decade, medicine has shifted from a disease-care model to a longevity and healthspan model. Patients aren’t just asking how long they will live, they want to know how well they can live. They expect measurable proof, personalized strategies, and proactive care.

That proof comes from longevity metrics: objective, data-driven biomarkers and performance measures that help clinicians uncover hidden risks, design precise interventions, and validate progress over time.

For clinics in concierge medicine, integrative health, and functional medicine, longevity metrics are not just a clinical advantage, they are a business differentiator. By delivering measurable results, practices increase patient trust, retention, and referrals while also creating scalable membership-based revenue streams.

This definitive training will cover the top longevity metrics every clinic should track, why they matter, and how to integrate them into daily practice with platforms like Heads Up Health.


Don't Miss The Next Data-Driven Medical Education

Sign Up Below To Get Notified

Guest Educator: Leonard Pastrana

Transforming longevity medicine from concept to clinical reality for 5,000+ medical practitioners worldwide: PharmD & Founder @ nuBioAge | Scientific Director | Speaker | Accelerating Leaders in Longevity Medicine.

Leonard is recognized as one of the foremost experts in longevity medicine, transforming the field from concept to clinical reality.

As the co-founder of nuBioAge and Scientific Director for multiple longevity initiatives, Leonard has trained and supported over 5,000 medical practitioners worldwide. His work goes beyond education, he has built a comprehensive ecosystem that equips providers with the tools, data, and strategies they need to implement longevity metrics, deliver personalized care, and scale successful programs. With deep expertise in biomarkers, precision therapies, and healthspan optimization, Leonard is accelerating the next generation of leaders in clinical longevity practice.

“As a PharmD and co-founder of nuBioAge, I’ve helped build the most comprehensive ecosystem in longevity medicine – one that doesn’t just educate providers, but gives them everything they need to deliver life-changing care and scale their impact.”

What Are Longevity Metrics?

Longevity metrics are quantifiable biomarkers, physiological measures, and health indicators that reflect a patient’s risk for disease and their capacity for healthy aging.

They go beyond traditional labs and vitals. While blood pressure and cholesterol remain useful, longevity metrics dive deeper into visceral fat, metabolic flexibility, cardiovascular capacity, lean mass, and early metabolic dysfunction.

The goal:

  • Identify risks years before symptoms appear.
  • Personalize care to each patient’s biology.
  • Validate progress with data patients can see and trust.

The 7 Core Longevity Metrics Every Practice Should Track

1. Visceral Adipose Tissue (VAT)Google Chrome 2025 08 27 22.24.23

  • What it is: VAT is the fat stored around internal organs. Unlike subcutaneous fat, VAT drives systemic inflammation, insulin resistance, and cardiometabolic disease.
  • How to measure: DEXA scans are gold standard; bioimpedance devices and MRI can also estimate VAT.
  • Why it matters: High VAT is linked to cardiovascular disease, Type 2 diabetes, and even cancer progression.
  • How to optimize: GLP-1 medications (Semaglutide, Tirzepatide), peptides like Tesamorelin, precision nutrition, and Zone 2 aerobic training.

2. Appendicular Lean Mass Index (ALMI)

  • What it is: ALMI measures lean muscle mass in arms and legs relative to height.
  • Why it matters: Low ALMI indicates sarcopenia, frailty, and increased fall risk. Muscle mass is a critical predictor of mobility and independence in older age.
  • How to measure: DEXA body composition scans.
  • How to optimize: Resistance training, leucine-rich nutrition, testosterone or hormone optimization when clinically appropriate.

3. VO₂ Max

  • What it is: The maximal oxygen uptake during exercise — essentially, cardiovascular fitness.
  • Why it matters: VO₂ max is the single strongest predictor of mortality, outperforming smoking status, diabetes, and hypertension.
  • How to measure: Treadmill testing with metabolic cart, breath analyzers like PNOĒ, or validated wearable proxies (Garmin, Polar).
  • How to optimize: Structured aerobic training, especially high-intensity intervals and progressive Zone 2 work.

4. Resting Metabolic Rate (RMR)

  • What it is: The number of calories burned at rest.
  • Why it matters: Patients with “slow metabolism” often struggle with weight loss and regain. Discrepancies between measured and predicted RMR reveal hidden metabolic dysfunction.
  • How to measure: Indirect calorimetry breath testing.
  • How to optimize: Tailored nutrition programs, lean mass preservation strategies, and metabolic rehabilitation.

5. Fat Oxidation (FatMax & Crossover Point)

  • What it is: Measures the exact point where fat burning peaks and where carb metabolism overtakes fat metabolism.
  • Why it matters: Fat oxidation metrics reveal metabolic flexibility and mitochondrial efficiency — both crucial for longevity.
  • How to measure: Metabolic breath testing devices (PNOĒ, VO₂ cart).
  • How to optimize: Zone 2 training, low-glycemic diets, mitochondrial support supplements.Frame 18

6. ApoB

  • What it is: Apolipoprotein B is a direct measure of atherogenic lipoprotein particle count.
  • Why it matters: ApoB is a more reliable predictor of cardiovascular risk than LDL-C. Elevated ApoB means accelerated plaque formation.
  • How to measure: Standard lab blood test.
  • How to optimize: Statins, PCSK9 inhibitors, lifestyle interventions, supplements like Sytrinol.Google Chrome 2025 08 27 22.32.39

7. Fasting Insulin

  • What it is: Baseline insulin level after fasting.
  • Why it matters: Elevated insulin can indicate metabolic dysfunction years before fasting glucose or HbA1c change.
  • Optimal range: ≤6–7 μIU/mL.
  • How to measure: Simple fasting blood test.
  • How to optimize: Low-glycemic diets, time-restricted eating, GLP-1s, berberine

Beyond the Basics: Additional Longevity Metrics

  • HRV (Heart Rate Variability): Marker of autonomic nervous system balance and stress resilience.
  • Sleep Quality & Stages: Tracked via Oura, Garmin, Whoop. Poor sleep accelerates biological aging.
  • Epigenetic Clocks: DNA methylation-based biological age tests (TruAge, DNAmAge).
  • Inflammatory Markers: hsCRP, IL-6 as indicators of chronic inflammation.
  • Cognitive Metrics: Reaction time, memory, and executive function testing.

From Data to Action: Personalizing Longevity Protocols

Metrics are only powerful if they drive interventions. Leading practices use HeadsUp Health to:

  • Centralize data from labs, wearables, and devices into one dashboard.
  • Set personalized protocols (exercise, nutrition, peptides).
  • Track longitudinal changes with real-time alerts.
  • Validate results with before-and-after reports patients can see.

This makes metrics actionable for both clinical care and patient motivation.

The Business Case: Why Longevity Metrics Grow Clinics

For practice owners, longevity metrics are not just science, they are strategy.

  • Retention: Patients stay engaged when they see progress. One concierge clinic reported a 32% increase in retention after adopting Personalize Health Analytics.
  • Revenue: Clinics packaging biomarker tracking into memberships have seen $87K+ in new annual revenue.
  • Differentiation: Data-driven outcomes set longevity clinics apart from wellness spas and traditional practices.
  • Investor Appeal: Validated outcomes with data attract partnerships and capital.

How to Implement Longevity Metrics in Your Practice

  1. Baseline assessment: Order a comprehensive lab + body composition + wearable data review.
  2. Build dashboards: Use a platform like HeadsUp Health to visualize data.
  3. Set alerts & thresholds: Get notified when metrics drift from targets.
  4. Review quarterly: Re-test metrics and adjust care plans.
  5. Package results: Present before/after reports in membership or VIP programs.

Tools, Training & ResourcesFrame 1000003340

Metrics Drive the Future of Longevity Medicine

Longevity medicine is no longer theory. By focusing on VAT, ALMI, VO₂ max, RMR, FatOx, ApoB, and fasting insulin, clinics can deliver measurable results that extend both lifespan and healthspan. The metrics exist, the tools exist, and the business case is clear. Clinics that adopt longevity metrics today will lead the next generation of personalized, preventive, and profitable medicine.

Clinical Longevity Certification With nuBioAge

Google Chrome 2025 08 28 22.45.08

Tracking Patient Health Data Has Never Been Easier!

Leverage The Power Of Heads Up in your Health Practice

Get started with by scheduling custom demo with one of our specialists to see the difference Heads Up can make in your practice. Schedule your demo and discovery call here.

Optimize Health & Longevity

Synchronize your clients’ medical records, labs, wearables, apps, and more into Heads Up for better outcomes. 
Sign Up now for a free starter account!