Continuous Glucose Monitoring Analytics Reporting
Heads Up Signals provides health professionals with a suite of CGM reports to better monitor and manage their clients’ glucose levels. Through the master dashboard, individual drill-down, the Cohort Performance Over Time report, Out of Range, Week over Week Improvement dashboards and Data Export report, health professional teams can identify areas of out of range, fluctuations, and improvements quickly. These reports allow for tracking of trends over time, and help health professionals better understand their clients’ glycemic control.
With these automated reporting tools, health professionals can then use this information to motivate and inspire their clients to take positive and informed actions towards maintaining their glucose levels. Ultimately, Heads Up Signals provides a comprehensive set of reports for health professionals to efficiently manage their clients’ glucose levels.
These reports have been designed to provide users with a clear overview of all the CGM and glucose statistics of their practice in one place, enabling easy identification of individual users who may need closer monitoring. The reports also allow for detailed analysis of the performance of specific cohorts, helping health professionals see glucose trends over time and identify areas for improvement.
The list of Continuous Glucose Monitoring (CGM) suite includes:
- Reports Overview
- Master Dashboard
- Cohort Performance Over Time
- Individual Drill Down
- Out of Range
- WoW Improvements
- Data Export
Reports Overview
The Out of Range report is another useful feature that highlights instances where different users may be exceeding safe levels, providing an early warning of potential concerns. The Week over Week Improvements report enables users to monitor positive trends in glucose levels and highlight the success of individuals in their practice. Lastly, the ability to export raw data is perfect for those who wish to analyze the data outside the platform. Overall, these new reports offer a powerful toolset for professionals to manage patient glucose data and monitor changes in real-time, in one single platform. Sign Up.
Master Dashboard
The new CGM Glucose Related Stats Master Dashboard showcases four key stats: average glucose, standard deviation of glucose, the time and range between 70 and 120, and the percentage of readings above 140. These stats are conditionally formatted to support ease of understanding, with recommendations from the experts in CGM and glucose. Users can adjust the conditional formatting and stats according to specific requirements for their practice. This dashboard helps users to manage glucose levels and track glucose data for all users in their practice via a single platform.
Individual Drill Down
The Individual Drill Down Dashboard allows users to select a specific user in their practice to see changes in their glucose stats over a certain time period in a graphical way. The individual drill-down dashboard displays glucose stats such as average, standard deviation, time and range, and spikes in a tabular format. Users can see how these measurements have changed over time for the selected individual. The report allows users to identify fluctuations and take actions to improve glucose levels for the individual in question.
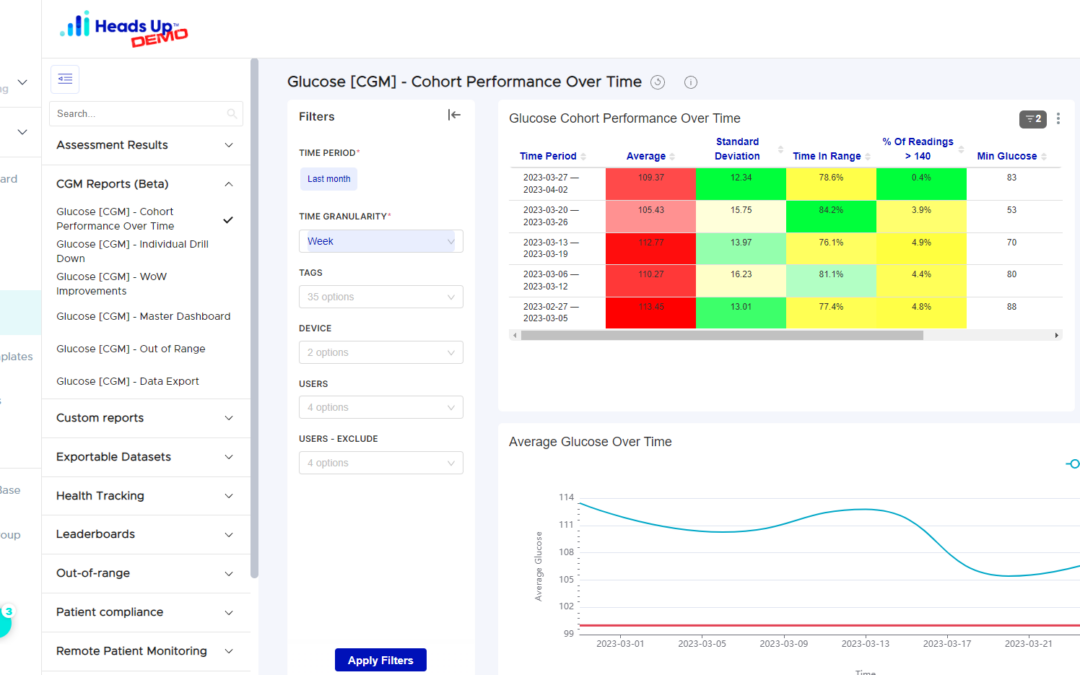
Cohort Performance Over Time
The Cohort Performance Over Time report displays the same glucose stats as the individual drill-down report but for the entire cohort. Users can see at a glance whether a new protocol or challenge is working for the population as a whole. Users can customize the report by selecting different time periods, granularity, specific users or groups using tags. This new report enables users to assess performance over time and quickly identify changes and fluctuations in the population, and make more informed decisions. Try it out for yourself.
Out of Range
The Glucose Out of Range report allows for health professionals to see who is out of range quickly and easily. Users can customize the report by setting criteria to define what you consider to be out of range glucose values. The report will then display readings where users go above or below the defined thresholds for a certain time period. Users can use this report to identify when users’ readings are out of range and engage in discussions to improve future readings. This report can help users take actions quickly and improve health outcomes.
WoW Improvements
The Week over Week Improvements dashboard is inspired by one of the health practitioners on the platform who used CGM in her practice, emphasizing the need to provide users with positive feedback to motivate compliance. The Week over Week Improvements dashboard is simple and shows on average for the week versus the previous week. What cohorts change in average glucose, standard deviation, and time and range have occurred. It also shows which users had the biggest metric changes in the positive direction, allowing practitioners to share positive feedback with these users for encouragement. This dashboard motivates users to continue with their actions and to strive for further improvements. Create a complementary account.