This is the third installment in a series of articles exploring lab tests for people following low-carb diets, and how this way of eating requires a slightly different perspective for interpreting the results compared to results from people eating more carbohydrates.
In part 1, we covered tests for blood sugar (fasting glucose, hemoglobin A1c, and fructosamine). In part 2, we explored fasting insulin, the most important test most doctors aren’t ordering. Taken together, these explain why fasting glucose and hemoglobin A1c in the “normal” ranges don’t always mean someone’s in the clear with regard to insulin sensitivity and healthy glucoregulation. (Crash course: for many people, dangerously high insulin is the only thing keeping glucose levels in a healthy range.)
Throughout this series, we’re emphasizing that health cannot be determined by any single measurement in isolation. It’s a mosaic, made up of many individual parts that are best assessed as a whole. With this in mind, let’s dig a little deeper into the relationship between glucose and insulin.
Homeostatic model assessment of insulin resistance (HOMA-IR)
HOMA-IR is a calculation that indicates your level of insulin sensitivity by taking into account the relationship between glucose and insulin. For this reason, HOMA-IR may be more informative for you and your doctor than either fasting glucose or fasting insulin alone.
“Homeostatic model assessment” sounds more complicated than it is. Let’s break it down and see what this means with regard to insulin sensitivity:
According to a medical dictionary, homeostasis is “the tendency of biological systems to maintain relatively constant conditions in the internal environment while continuously interacting with and adjusting to changes originating within or outside the system.”
- The state of equilibrium (balance between opposing pressures) in the body with respect to various functions and to the chemical compositions of the fluids and tissues.
- The processes through which such bodily equilibrium is maintained.
In plain English, homeostasis means that your body doesn’t want anything to get too far out of whack and it has ways of keeping things in check. We do it with blood pressure, core body temperature, blood pH (acidity level), and more.
The medical dictionary also explains homeostasis as “a relative constancy in the internal environment of the body.”
The key phrases here are relative constancy and bodily equilibrium—meaning, neither too high nor too low. The homeostatic model assessment measures how hard the body is working to maintain that relative constancy and equilibrium.
We don’t want blood glucose going too high or too low. For the vast majority of the population, the concern is blood glucose that’s too high. And since insulin is the primary thing that prevents glucose from going too high, HOMA-IR tells us how hard the body is working to keep blood glucose from getting dangerously high. That is, how much insulin does the pancreas have to produce in order to maintain blood glucose at a certain level?
Bottom line: the higher your HOMA-IR, the more insulin resistant you are.
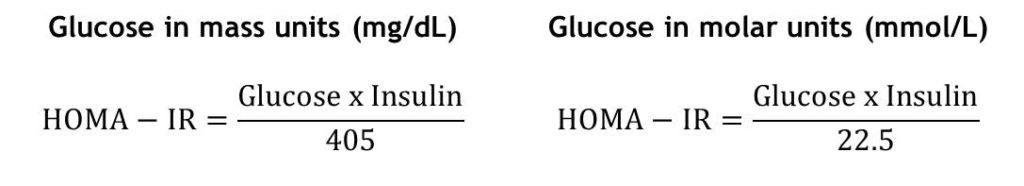
How to Calculate HOMA-IR:
Guidelines for HOMA-IR vary in the published medical literature. Doctors who use low-carb and Paleo-style diets in their practices—and who recognize the importance of this measurement—have guidelines similar to these, from Richard Maurer, ND, creator of The Blood Code™:
- Optimal insulin sensitivity: < 1
- Early insulin resistance: > 1.9
- Significant insulin resistance: > 2.9
Here are some examples:
Patient A Patient B
Fasting glucose: 90 mg/dL Fasting glucose: 82 mg/dL
Fasting insulin: 4 μIU/mL Fasting insulin: 14 μIU/mL
HOMA-IR: (90 x 4) / 405 = 0.88 HOMA-IR: (82 x 14) / 405 = 2.83
Patient A’s fasting glucose is higher than Patient B’s, but Patient A’s insulin is much lower. By taking both glucose and insulin into account, the HOMA-IR scores show us that even with lower fasting glucose, Patient B is at greater risk for metabolic complications down the road.
Where HOMA-IR Shines
In part 1 of this series, we noted that in people following low-carb or ketogenic diets, fasting glucose is sometimes higher than we would expect. We covered a couple of reasons for this, but one we saved for this installment is lower insulin levels. If someone’s fasting glucose is slightly elevated in conjunction with insulin being nice and low, this may actually be less indicative of metabolic problems than lower glucose with higher insulin.
Researchers have noted, “Insulin-mediated glucose disposal varies severalfold in apparently healthy individuals.” Meaning: people vary widely in the amount of insulin required to keep their blood glucose at similar levels. (Example: In order to maintain a glucose level of 85 mg/dL, Tom requires 3 μIU of insulin, but Stacey requires 18 μIU units. With a HOMA-IR of 3.7 compared to Tom’s HOMA-IR of 0.63, Stacey’s body is working much harder—and she’s at much greater risk for multiple conditions associated with insulin resistance and hyperinsulinemia.)
Here’s a great illustration of this, shared with permission from Ted Naiman, MD, a family medicine specialist who uses low-carb and ketogenic diets with his patients. The takeaway lesson is, fasting glucose doesn’t tell you much if you don’t know your insulin level:
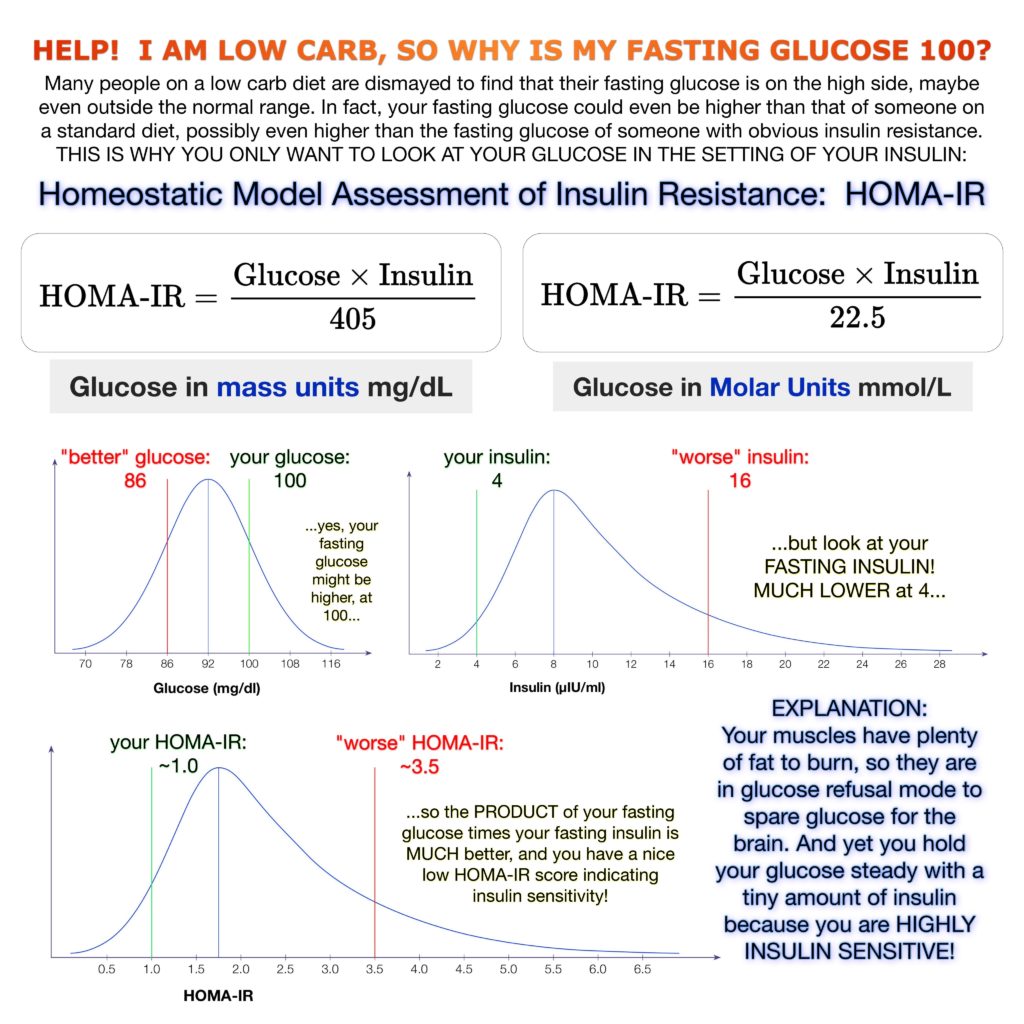
Slightly higher fasting glucose isn’t a reason for alarm if insulin levels are low. (Excluding type 1 diabetes.)
You can easily measure your fasting glucose at home. (And record it here at Heads Up Health so you can see trends over time.) But since you can’t measure insulin yourself, you’ll need to ask your doctor to order a fasting insulin test for you. Ideally, the doctor will create a lab order to have fasting insulin and fasting glucose tested together. Unfortunately, many doctors are reluctant to order a fasting insulin test if you do not have diabetes or pre-diabetes. In these cases, you may want to consider ordering this test on your own. (See our guide for more information on ordering your own lab tests.)
Even if you can’t order your own labs, there are still ways to get at least a general sense of where you stand in terms of insulin sensitivity. According to Dr. Naiman, your waist-to-height ratio is a reasonable proxy for HOMA-IR. You can assume if your waist-to-height ratio is improving (that is, getting smaller), your insulin sensitivity is improving as well. If you’re bigger around than you are tall, you’re in serious trouble! But since almost no one falls into that category, for general health, a waist-to-height ratio of 0.5 or slightly less is ideal. (Elite athletes might be closer to 0.45.) This is easy to measure at home: simply use a tape measure to measure your waist circumference, and divide that number by your height. Just be sure to use the same units for both, whether that’s inches or centimeters.)
(Pro-tip: Track your measurements easily using Heads Up Health’s new body tape measurements feature.)
Track your results
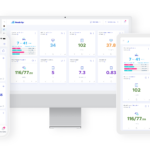
Heads Up Health can help you track your important lab test results so you can make informed, data-driven decisions when it comes to your health. You can easily track your fasting glucose, fasting insulin, and HOMA-IR tests in your Head Up profile. The screenshot below shows how you can enter this data into your Heads Up profile:

Track your HOMA IR results with Heads Up Health
For our users within the United States, you can also electronically connect your medical facility and instantly import your lab test results. Lastly, you can track all other lifestyle metrics (weight, body fat, blood sugar, exercise, etc.) to understand how your lifestyle choices impact your metabolic health.
Coming up…
All this being said, HOMA-IR is still based on fasting levels. Insulin could be elevated for the majority of the day but have come back down overnight so that the fasting level is normal. In this case, a person could still be at risk for medical issues associated with insulin resistance, but it’s likely that some measurements—if not multiple measurements—would indicate insulin resistance. There will be “canaries in the coalmine” even if fasting insulin (and, therefore, HOMA-IR) looks good. We’ll look at some of these other measurements in future posts.


Where can I get my insulin level tested and does insurance pay
Why is it that no insurance company pay for a Homa=IR test in the usa? Isnt it a better way to check if you are insulin resistant? I would like to know if I can get this test if I pay for it out of pocket
I too want a HOMA_IR test and have not been able to get a doctor to prescribe it. I plan to call a diagnostic laboratory or two to see if I can simply buy the test — without a doctor being involved at all.
My doctor didn’t want to do it either. However, I told her if she didn’t want to do it to make a note in my online file (which I can see via a portal any time I want) that I asked for the test and she refused. I told her that if my insurance didn’t pay for it, I would happily pay for it. She then agreed to the test and I now have my results.
Doctors work for you. I had an endocrinologist that didn’t want to run a Growth Hormone test for me. She said, “That is very rare, it would just be a waste of money.” I told her to run the test anyway and that my insurance would cover it or I would. She ran it and when the results came back, she said, “Well, it looks like you might have low Growth Hormone.” I said, “How can that be? After all, it is very rare.” She looked at me funny and I said, “Do you know why it is rare?” and she said “no”. I said, “It’s because you doctors never test for it. If you don’t test for it, how can anyone know how prevalent it is in society?” That was the day I decided that I don’t work for the doctors; they work for me. If they don’t do what I want, I’ll change to one who will. I now use Nurse Practitioners more that doctors. First thing I tell them is the first time they refuse a test I want, is the last time I’ll see them.
anthem BCBS covered Homa Ir Panel on a lab that was done in 2020. It might have more to do with the diagnosis code that your doctor submitted. I’d try again.
Can you tell me which lab runs this panel ?
My glucose is historically high, my insulin has never been tested. I have all the symptoms of diabetes and eat a 95% meat diet. My doctor refuses to order a HOMA IR fasting blood test. What do I do?
My doctor didn’t want to do it either. However, I told her if she didn’t want to do it to make a note in my online file (which I can see via a portal any time I want) that I asked for the test and she refused. I told her that if my insurance didn’t pay for it, I would happily pay for it. She then agreed to the test and I now have my results.
Try another doctor, maybe even Functional Medicine or Integrative. Also, you can call your insurance company and request that they give you names of providers that do the kind of testing that you’re looking for. They should be able to access that information in their system. I’ve done that with my insurance company.
How quickly does your blood insulin level drop? I fasted for 15 hours before my Homa-IR test and it still came out as 3.39. I was very disappointed as I have been following a ketogenic diet and intermittent fasting for several weeks now.
For me it took about 3 years to get from 1.95 to 0.99. Don’t stress, it will slowly get better.
Hi Rosie,
I am not a medical professional, but my understanding is that HOMA-IR will take months of care to make meaningful adjustments, not hours or days. Maybe try it again after 6 months of healthy lifestyle changes? I think blood sugar changes are quick and insulin resistance is slow. Other are in the middle somewhere…
Goodluck.
I got mine done, without a doctor’s prescription, by using Ulta Lab Tests in the US. The actual lab tests were performed by Quest Diagnostics. It appears that the service is available in all, but 3, states in the US.
Hi! I am a beginner of HOMA. From the above equation, I understood.
However, I am not sure the formula of HOMA2 %beta and HOMA2 %S.
I know there is some differences from original HOMA and HOMA2.
Any experts can tell me the formula of HOMA2 ? Thanks a lot!