Written by Andrew Flatt, Dave Korsunsky and Chuck Hazzard
Overview
We’ve released an experimental feature in Heads Up Health which automatically calculates the HRV coefficient of variation (CV) based on the data from your Oura ring.
Why track HRV CV?
Looking at daily HRV readings enables you to note short-term fluctuations relative to your baseline. This can be useful for observing the effects of various stressors and lifestyle factors which can help inform on behavior-modification strategies to optimize your HRV.
Due to daily fluctuations, an isolated (i.e., single time-point) HRV measure may not truly reflect an individual’s typical HRV. Thus, some researchers and practitioners are moving towards averaging a series of daily measures to better characterize one’s autonomic activity. In turn, most HRV apps are now reporting a rolling weekly average of your HRV values.
Tracking the rolling weekly average provides a better indication of whether your HRV is actually changing in a given direction. In addition, instead of reacting to an isolated change in HRV, a more conservative and convenient approach would be to react only when the rolling average starts to change. One low HRV reading may not be of much concern and would have little impact on the weekly average. However, a series of low scores will reduce the rolling average and may indicate that it’s time to do something about it.
Along with your rolling weekly HRV average, further insight can be gained by monitoring the Coefficient of Variation (CV) among the rolling HRV values. This is because the magnitude of HRV fluctuations can change from week to week, with or without out much change in the rolling average. How much your HRV fluctuates on a day-to-day basis is quite meaningful. Large fluctuations increase the CV while smaller fluctuations lower it.
Interpreting HRV Coefficient of Variation (HRV CV) values
Typical HRV CV values range from 2 – 20%. If we were to take a random sample of adults and measure their HRV for a week, we would probably find that individuals who are younger, healthier (i.e., without disease), leaner and more aerobically fit will fall on the lower end of that range and less-healthy individuals on the higher end.
Regardless of what your CV is at a given time, it’s important to know that it can and will change. Now, whether an increase or decrease in your CV should be interpreted as good or bad is entirely context-dependent. We’ll use some practical examples to explain.
Among healthy individuals, an increased CV is typically associated with greater stress, fatigue, and lower fitness. Vice versa for a lower CV. Thus, the CV is a useful value for assessing adaptation to a new fitness program or lifestyle change. For example, unfamiliar stress will typically cause greater fluctuations in HRV (i.e., increased CV). However, as you become familiar with the new routine, there should be less fluctuation (i.e., decreased CV) which is a sign of positive adaptation. What was once quite stressful to your body is no longer as stressful.
Reductions in the CV are typically good, indicative of increasing fitness, lower stress (or improved stress tolerance) and so forth. There are exceptions, however. For example, suppose your new training program or work schedule is overbearing. Accumulating stress causes an initial increase in your CV. As things continue, your healthy eating habits start to wane, your sleep deteriorates and you become rundown. In this context, your HRV readings may become chronically suppressed, failing to bounce back to baseline. Thus, your rolling average has now decreased, as has your CV.
How we calculate Oura HRV CV
At the time of this post, Oura currently does not report the HRV CV in their app. Thus we are calculating this in Heads Up Health using the average HRV value during the sleep cycle as reported by the Oura app:
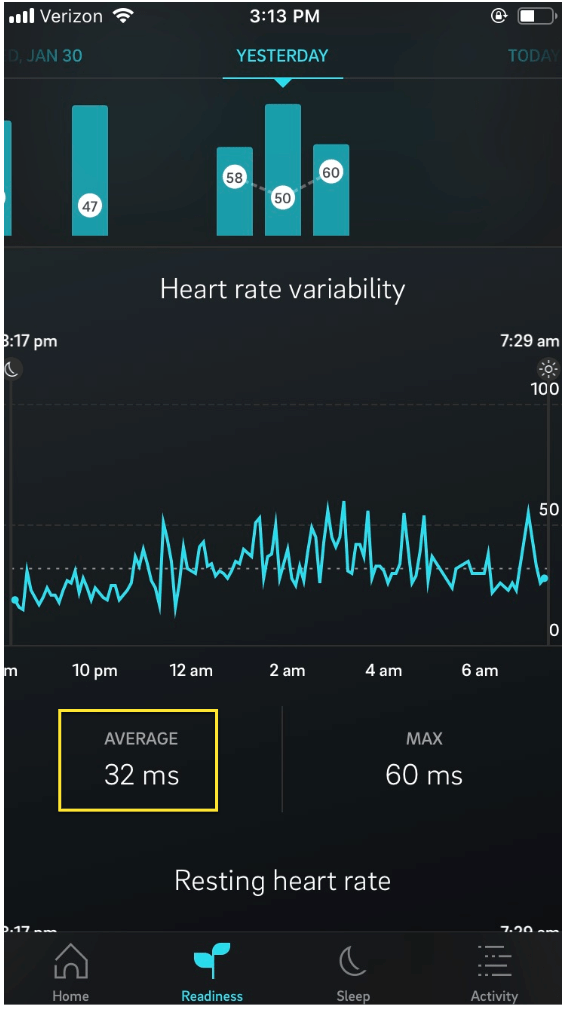
Figure 1: Oura HRV Average
Using these average HRV values we then calculate the Oura Coefficient of Variation (HRV CV) as follows:
- Calculate the natural logarithm (ln) value of the nightly HRV average as reported by the Oura app (figure 1)
- Calculate the mean and standard deviation from the prior 7-day HRV values
- Divide the standard deviation by the mean
- Show as a percentage
Note: Some experts in the field have suggested a more accurate method would be to look at the Oura HRV readings from the deep (slow wave) sleep states or by looking at the HRV readings just prior to waking. We are open to changing our approach here based on feedback from users. Feel free to send us your comments.
Tracking Oura CV in Heads Up Health
You can now add the Oura CV metric onto your Heads Up Health dashboard:
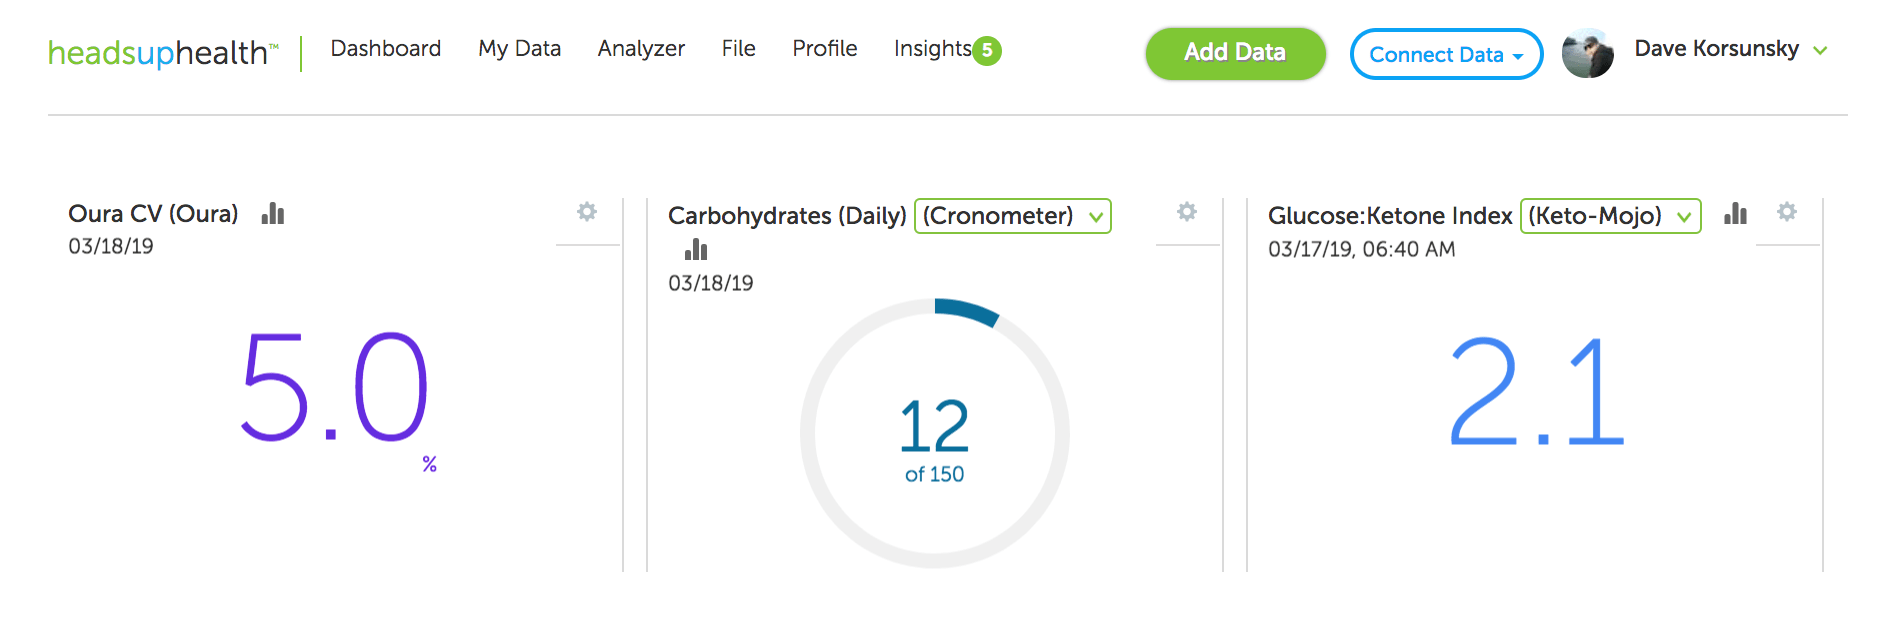
Figure 2: Add the Oura HRV CV to your dashboard
You can also graph this marker on the Analyzer next to any other health metric to explore your own correlations:
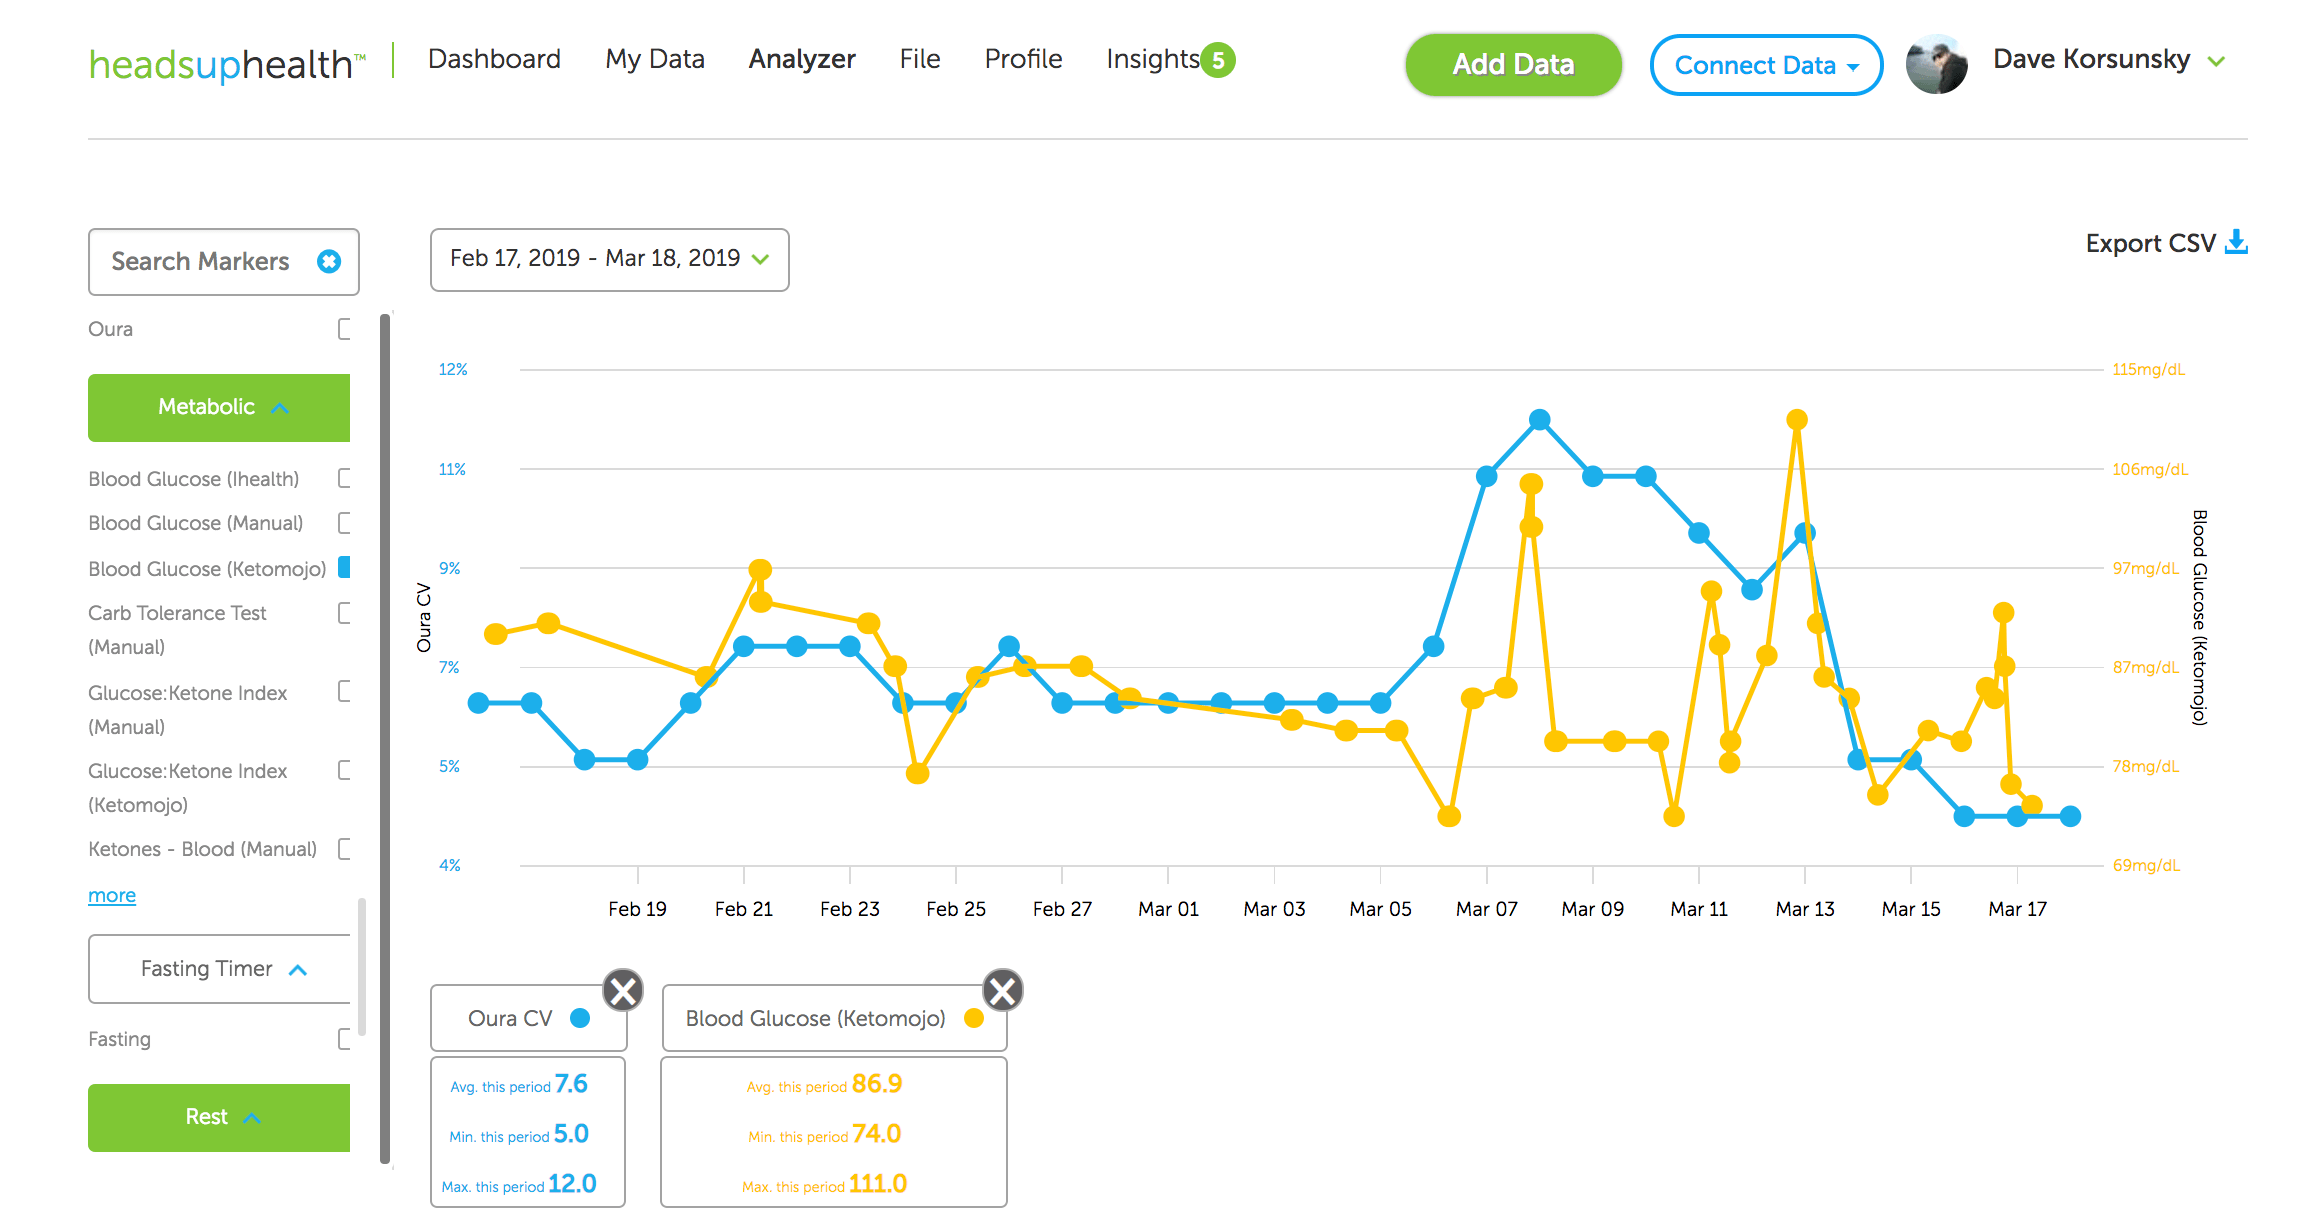
Figure 3: Compare your Oura HRV CV metrics on the Analyzer
Moving the needle
Why would these numbers increase or decrease? The CV reflects the fluctuation in your day-to-day HRV over the last 7 days. High or low HRV readings relative to your baseline will, therefore, contribute to a higher CV whereas more consistent or stable HRV readings will contribute to a lower CV.
Why is lower better?
When the rolling average is stable or increasing, a lower CV reflects less disturbance in autonomic homeostasis. This may mean that you are experiencing less stress or simply coping with it better.
The CV must always be interpreted in context. For example, a night of high-quality sleep may increase HRV well-above baseline, contributing to a higher CV. In a situation like this, the elevated CV is obviously not reflecting higher stress. In addition, stress is important as it stimulates adaptation. Therefore, an increased CV is a normal response to a greater or novel stimulus. However, repeated exposure and adaptation to the stimulus should provoke smaller HRV fluctuations over time and therefore a lower CV. Here, the reduced CV reflects an improved ability to tolerate and recover from the stressor and thus a capacity for greater stress.
Important lifestyle factors which can affect HRV CV
Any factor that alters HRV from baseline contributes to an increased CV. Common factors that affect HRV include:
- Travel/jet lag
- Physical stress such as high-intensity exercise
- Mental and emotional stress
- Over-training / injury
- Sleep quality and quantity
- Illness
- Drastic changes to daily routines
- Pain
- Blood sugar fluctuations
- Hydration
Heads Up Health can help you holistically track these other lifestyle factors to help identify areas that need attention.
Summary
The HRV CV is another powerful biomarker we can use to further understand how we are managing the stressors in our daily lives. Heads Up Health now supports this metric. This is an initial implementation and we will further refine this feature as required.
Ready to start tracking your Oura HRV CV? Start your free trial using the button below!
[maxbutton id=”9″ ]
References and Recommended Reading on the CV
Flatt, A.A. Improving HRV Data Interpretation with the Coefficient of Variation https://elitehrv.com/improving-hrv-data-interpretation-coefficient-variation
Buchheit, M., Mendez-Villanueva, A., Quod, M. J., Poulos, N., & Bourdon, P. (2010). Determinants of the variability of heart rate measures during a competitive period in young soccer players. European journal of applied physiology, 109(5), 869-878.
Flatt, A. A., & Howells, D. (2019). Effects of varying training load on heart rate variability and running performance among an olympic rugby sevens team. Journal of science and medicine in sport, 22(2), 222-226.
Flatt, A. A., Esco, M. R., Allen, J. R., Robinson, J. B., Earley, R. L., Fedewa, M. V., … & Wingo, J. E. (2018). Heart rate variability and training load among national collegiate athletic association division 1 college football players throughout spring camp. The Journal of Strength & Conditioning Research, 32(11), 3127-3134.
Flatt, A. A., & Esco, M. R. (2016). Evaluating individual training adaptation with smartphone-derived heart rate variability in a collegiate female soccer team. The Journal of Strength & Conditioning Research, 30(2), 378-385.
Flatt, A. A., Hornikel, B., & Esco, M. R. (2017). Heart rate variability and psychometric responses to overload and tapering in collegiate sprint-swimmers. Journal of science and medicine in sport, 20(6), 606-610.
Flatt, A. A., Esco, M. R., Nakamura, F. Y., & Plews, D. J. (2017). Interpreting daily heart rate variability changes in collegiate female soccer players. J. Sports Med. Phys. Fitness, 57, 907-915.
Flatt, A. A., & Esco, M. R. (2015). Smartphone-derived heart-rate variability and training load in a women’s soccer team. International journal of sports physiology and performance, 10(8), 994-1000.
Nakamura, F. Y., Pereira, L. A., Rabelo, F. N., Flatt, A. A., Esco, M. R., Bertollo, M., & Loturco, I. (2016). Monitoring weekly heart rate variability in futsal players during the preseason: the importance of maintaining high vagal activity. Journal of sports sciences, 34(24), 2262-2268.
Plews, D. J., Laursen, P. B., Kilding, A. E., & Buchheit, M. (2012). Heart rate variability in elite triathletes, is variation in variability the key to effective training? A case comparison. European journal of applied physiology, 112(11), 3729-3741.
Tonello, L., Reichert, F. F., Oliveira-Silva, I., Del Rosso, S., Leicht, A. S., & Boullosa, D. A. (2016). Correlates of heart rate measures with incidental physical activity and cardiorespiratory fitness in overweight female workers. Frontiers in physiology, 6, 405.


When will this be avail as a tile in the app via Oura?
Hi Tiffany. Version 2.1 of the mobile app is coming this week. We will add the Oura CV in version 2.5 if not sooner…
Thanks Dave. I’m still not seeing it in the app. Am I missing something?