CGM Dashboard
Estimated reading time: 6 minutes
Optimize Patient Care with Heads Up’s CGM Dashboard: A Solution for Health Professionals
Continuous Glucose Monitoring (CGM) has become an indispensable tool in managing diabetes and optimizing overall health. However, health professionals often face challenges in utilizing their clients’ CGM data effectively without a centralized dashboard. Heads Up’s CGM Dashboard offers a comprehensive solution to automate the collection of glucose data, streamline health management, and improve patient outcomes.
The Problem: Disjointed CGM Data Management
Health professionals frequently encounter issues when dealing with CGM data from multiple clients. The absence of a centralized platform to automate and analyze glucose data can lead to inefficiencies and missed opportunities for timely interventions. Manually logging and correlating CGM data with other health metrics is not only time-consuming but also prone to errors.
Common CGM Data Challenges:
- Fragmented Data Sources: Health professionals often receive CGM data from various devices and apps, making it difficult to consolidate and analyze.
- Manual Data Entry: Without automation, professionals must manually enter data, increasing the risk of inaccuracies and consuming valuable time.
- Limited Insights: Isolated CGM data offers limited insights into overall health, making it challenging to identify correlations and trends.
The Solution: Heads Up’s CGM Dashboard
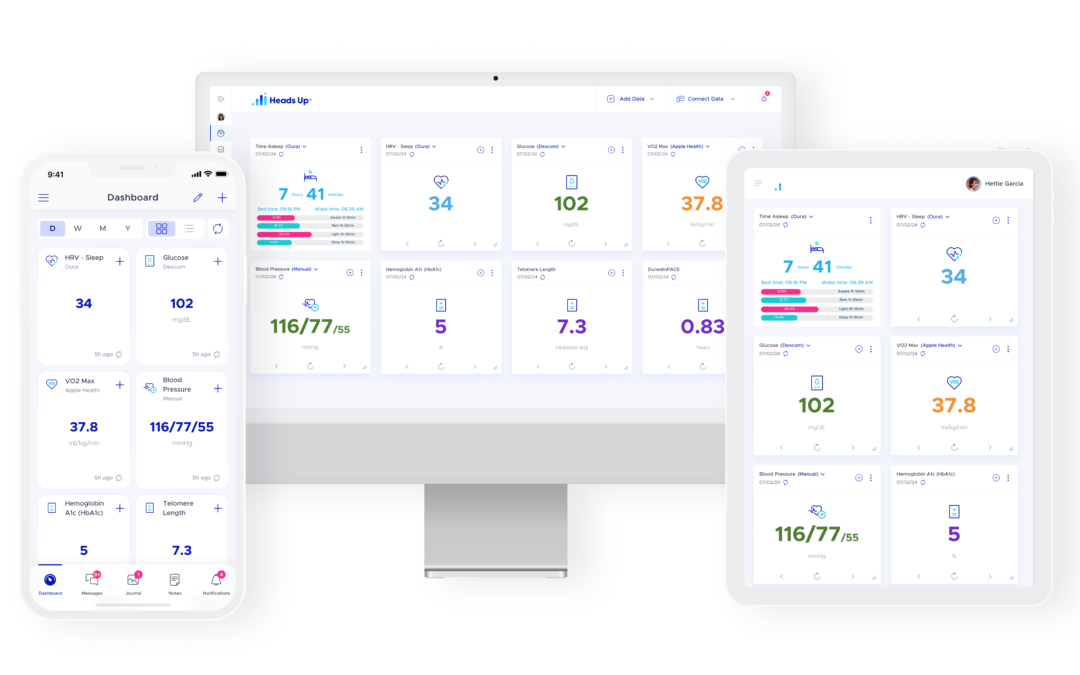
Heads Up’s CGM Dashboard integrates seamlessly with leading CGM devices such as Dexcom and FreeStyle Libre, providing health professionals with a centralized platform to automate data collection and analysis. This integration enables real-time syncing of glucose data, offering a holistic view of a patient’s health.
Key CGM Dashboard Features:
- Seamless Integration: Sync data from Dexcom and FreeStyle Libre automatically, eliminating the need for manual data entry.
- Comprehensive Tracking: Combine CGM data with other biometric data such as sleep patterns, heart rate variability (HRV), weight, and blood pressure.
- Advanced Analytics: Use the Report Analyzer to generate detailed reports that correlate CGM data with other health metrics, uncovering valuable insights and trends.
Benefits for Health Professionals
Enhanced Efficiency
With Heads Up’s CGM Dashboard, health professionals can streamline their workflow by automating the collection and analysis of glucose data. This efficiency frees up time for more critical tasks, such as patient consultations and care planning.
Improved Patient Outcomes
By analyzing CGM data alongside other health metrics, professionals can gain a deeper understanding of their patients’ health. This comprehensive analysis enables early detection of adverse trends and timely interventions, significantly improving patient outcomes.
Personalized Care
Heads Up’s platform allows for the creation of customized dashboards and reports, tailoring insights to each patient’s unique health profile. Personalized care plans can be developed based on precise data, enhancing patient engagement and adherence.
Addressing Patient Monitoring and Compliance Issues
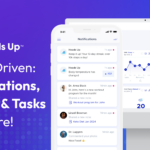
Heads Up’s CGM Dashboard also addresses common patient monitoring and compliance issues by providing real-time alerts and reminders. Health professionals can set customizable notifications to monitor glucose levels and other vital metrics, ensuring patients stay on track with their health management plans.
Key Features for Monitoring and Compliance:
- Customizable Data-Driven Alerts: Receive instant notifications when patients’ glucose levels deviate from the norm, allowing for proactive management.
- Automated Tasks: Schedule reminders for important health assessments and log entries to keep patients engaged and compliant.
- Personalized Reminders: Send personalized reminders to patients for checking and logging health metrics, ensuring consistency and accuracy in data.
Integration Capabilities with Other Health Platforms
Heads Up’s CGM Dashboard goes beyond glucose monitoring by integrating with various health platforms and devices. This compatibility ensures that health professionals can have a comprehensive view of their patients’ health data.
Integration Examples:
- Electronic Health Records (EHRs): Integrate CGM data with EHRs for a unified patient record.
- Wearables and Fitness Apps: Sync data from devices like Fitbit, Apple Health, Garmin, and more.
- Diagnostic Labs: Incorporate lab results from LabCorp, Quest Diagnostics, and others into the dashboard.
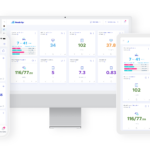
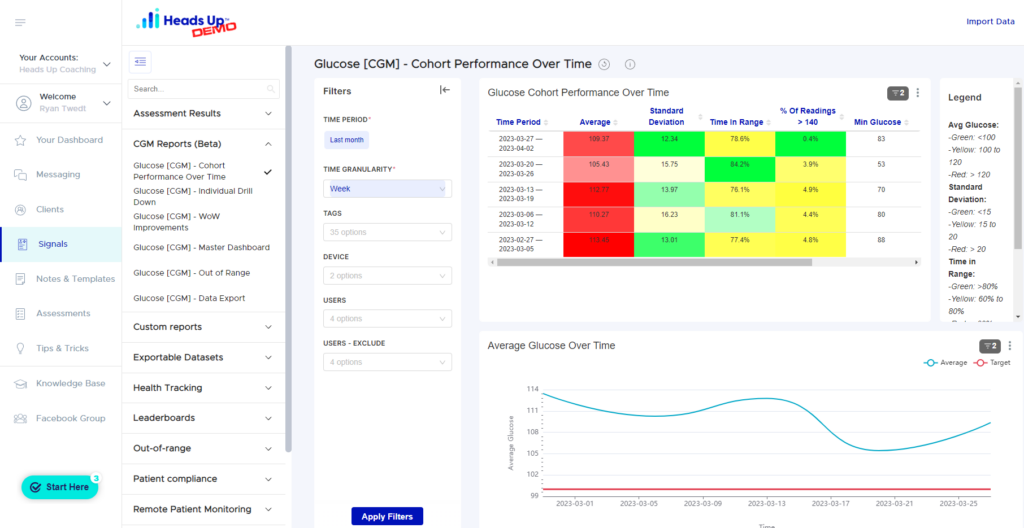
Customizable Data Visualization
Heads Up’s CGM Dashboard offers customizable graphs and charts that make it easy to visualize trends and patterns in glucose data. These visualizations help health professionals quickly identify areas of concern and track the effectiveness of interventions.
Benefits of Data Visualization:
- Simplified Analysis: Easily interpret complex health data through clear visualizations.
- Trend Identification: Quickly spot trends and correlations between different health metrics.
- Enhanced Reporting: Generate professional reports that can be shared with patients and other healthcare providers.
Case Studies and Testimonials
Case Study: Improved Diabetes Management with CGM Data Integration
In a study involving 400 patients, Heads Up demonstrated a 30% reduction in healthcare costs by optimizing treatment protocols through integrated data analytics. Clinical outcomes improved significantly, with a 25% increase in treatment adherence and a 20% reduction in emergency room visits.
Testimonials:
- Dr. Kristine Burke, True Health Functional Medicine Practice: “Heads Up has turned a mess of PDF files and patient portals into beautiful charts and graphs, making analyses much faster and more comprehensive.”
- Dr. Innocent Clement, Founder & CEO, Ciba Health: “We use Heads Up to flag out-of-range glucose values and weight readings, allowing our coaches to prioritize clients needing attention first.”
Security and Compliance
Ensuring the security and privacy of patient data is a top priority for Heads Up. The platform complies with healthcare regulations such as HIPAA, providing health professionals with peace of mind.
Security Features:
- Data Encryption: All patient data is encrypted both in transit and at rest.
- Access Controls: Robust access controls ensure that only authorized personnel can view sensitive data.
- Audit Logs: Comprehensive audit logs track all data access and modifications for accountability.
Future Developments and Innovations
Heads Up is committed to continuous innovation and regularly updates the CGM Dashboard with new features and improvements. Upcoming developments include enhanced data visualization tools, new integrations with health devices, and advanced predictive analytics.
Educational Resources and Support
Heads Up offers a range of educational resources and support options to help health professionals make the most of the CGM Dashboard.
Available Resources:
- Webinars and Tutorials: Regular webinars and video tutorials to guide users through the platform’s features.
- Customer Support: Dedicated support team available to assist with any questions or issues.
- Continuing Education: Opportunities for continuing education credits and certifications.
Get Started Using CGM Dashboards
Heads Up’s CGM Dashboard is a game-changer for health professionals seeking to optimize patient care through efficient and comprehensive data management. By integrating with Dexcom and FreeStyle Libre and enabling the analysis of CGM data alongside other biometric data, Heads Up provides the tools needed to enhance patient outcomes and streamline health management.
Start leveraging the power of Heads Up’s CGM Dashboard today and transform your approach to patient care.
Get Started with a Free Demo + Trial Account.
References:
- Heads Up CGM Dashboard + RPM For Type-2 Diabetes
- Dexcom
- FreeStyle Libre
- Podcast: CGMs help improve patient awareness and better choices.
- Heads Up Health Help Center: CGM Dashboard Package
- Using Continuous Glucose Monitors in RPM
- Training: Using Signals Reporting for Cohort CGM Data analysis
- CGM Reporting Suite